4.1 Hypothesis Testing: Introduction
Hypothesis Testing: M&M's
- Proportion of Blue M&M’s (Our Claim)
CLAIM: We believe __________________ percent of M&M’s are blue.
- This is your claim. It is your best educated guess about what you think is accurate about M&M’s.
- In this hypothesis test, our claim is also the null hypothesis. (The claim is not always your null.)
- We have to run a test to decide if we are going to reject or fail to reject the null hypothesis.
Claim:
Null hypothesis \(H_0\\\):
Alternate hypothesis \(H_A\\\):
- Random Sample
- Assume the null hypothesis is true.
- When we take a random sample from a normally distributed population, we expect the sample to look like the population.
- Based on our claim, if we get a sample of 32 M&M’s, we expect _________ of our 32 M&M’s to be blue.
- If we are right, what numbers of blue M&M’s in our sample have a high probability of occurring? _________________________
- How many blue M&M’s in our sample would make us question that our claim is right? _____________________________________
- Running the test in StatCrunch
- Get a random sample of 32 M&M’s.
- _________ of my 32 M&M’s are blue.
- StatCrunch – Stats – Proportion Stats – One Sample - With Summary
- StatCrunch calculates the probability of your sample having _________ blue M&M’s out of 32 when you expected __________ blue M&M’s out of 32.
- We have a measure in statistics to determine if we reject or fail to reject a null hypothesis. It is called a p-value. It is based on probability.
- My p-value from StatCrunch is ____________.
- Choose Alpha
- Assuming that _____% of M&M’s are blue, how unusual must the sample be before we reject our null hypothesis?
- If this had been a “real” hypothesis test, we would have established ahead of time the lowest acceptable probability. Usually statisticians use 1%, 5%, or 10% for the lowest acceptable p-value depending on the type of study and how accurate they need to be.
- A lower significance level means that the evidence in the data needs to be stronger to reject the null hypothesis.
- Alpha: α = _________
- Comparing the p-value to Alpha (choose one)
- Decision (choose one)
- Concluding Statement (choose one)
____ There is sufficient sample evidence to reject the claim that ______ % of M&M’s are blue.
_____ There is not sufficient sample evidence to reject the claim that ______ % of M&M’s are blue.
- Translate the following into inequalities.
Words Inequality The mean is at least 2. \(\mu \geq 2\)
The proportion is less than 25%. \(p<0.25\)
The mean is no more than 18. \(\mu \leq 18\)
The proportion is more than 0.21. \(p>0.21\)
The proportion is at least 26%. \(p \geq 0.26\)
The mean is 16. \(\mu=16\)
The mean is less than 4. \(\mu<4\)
The proportion is not 50%. \(p \neq 0.50\)
- Let’s say we want to test the claim that the 2023 Toyota Prius gets an average of at least 58 miles per gallon during city driving.
- Claim:
\( \mu \geq 58 \) - \(H_0\):
\( \mu \geq 58 \) - \(H_A\):
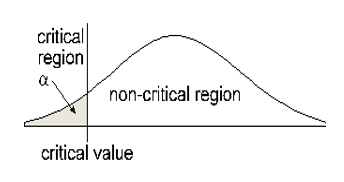
\( \mu < 58 \) - Type of Test:
Left-tailed - Draw a graph of the critical (rejection) region.
Claim has \( =,\ \ \le,\ \ \geq\) Claim has \( \neq,\ <,\ \ >\) Claim is null hypothesis Claim is alternate hypothesis
(The null hypothesis is what we assume to be true about the population.)
(The alternate hypothesis is the complement of the null hypothesis.)
(The alternate hypothesis determines whether you have a left-tailed, right-tailed, or two-tailed test.)
Symbol for the Alternate Hypothesis Type of Test \(\neq\) Two-tailed \(<\) Left-tailed \(>\) Right-tailed
- Claim:
- The Madison advertising agency wants to test the claim that the percentage of people who prefer milk chocolate over dark chocolate is 70%.
- Claim:
\(p=0.7\) - \(H_0\):
\(p=0.7\) - \(H_A\):
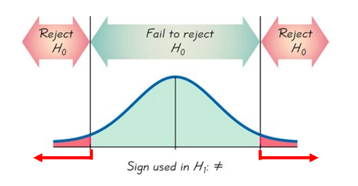
\(p \neq 0.7\) - Type of test:
Two-Tailed - Draw a graph of the critical (rejection) regions.
- Suppose we reject the null hypothesis. Write a concluding statement.
There is sufficient sample evidence to reject the claim that the percentage of people who prefer milk chocolate over dark chocolate is 70%. Claim has \( =,\ \ \le,\ \ \geq \) Claim has \( \neq,\ <,\ \ > \) Claim is null hypothesis Claim is alternate hypothesis Reject the null hypothesis “There is sufficient sample evidence to reject the claim that…” “There is sufficient sample evidence to support the claim that…” Fail to reject the null hypothesis “There is not sufficient sample evidence to reject the claim that…” “There is not sufficient sample evidence to support the claim that…”
- Claim:
- Proportion of Purple Skittles (Our Claim)
CLAIM: (choose one of the following – put a box around the claim you choose)
- We believe less than than 20% of Skittles are purple.
- We believe greater than 20% of Skittles are purple.
In this hypothesis test, our claim is also the alternate hypothesis HA.
Claim:
Null hypothesis \(H_0\\\):
Alternate hypothesis \(H_A\\\):
- The null hypothesis is what we assume to be true.
- We will assume that the percentage of purple Skittles is equal to 20%.
- Random Sample
- Assume the null hypothesis is true, that 20% of Skittles are purple.
- If the population of Skittles has 20% purple candies and we pull a random sample of Skittles from that total population, then we expect the sample to also have 20% purple candies.
- Based on this assumption, if we get a sample of 30 Skittles, we expect _________ of our 30 Skittles to be purple.
- If are assumption is correct, what numbers of purple Skittles in our sample have a high probability of occurring? _________________________
- How many purple Skittles in our sample would make us question that our assumption is correct? _____________________________________
- Choose Alpha
- Assuming that 20% of Skittles are purple, how unusual must the sample be before we reject our null hypothesis? 1%? 5%? 10%?
- The significance level (alpha) is the probability of accidentally making the wrong conclusion.
- In other words, what is the probability of rejecting the null hypothesis when it’s actually true?
- Alpha: α = _________
- Running the test in StatCrunch
- Get a random sample of 30 Skittles.
- _________ of my 30 Skittles are purple.
- StatCrunch – Stats – Proportion Stats – One Sample - With Summary
- StatCrunch calculates the probability of your sample having _________ purple Skittles out of 30 when you expected __________ out of 30.
p-value is ____________.
- Comparing the p-value to Alpha (choose one)
- Decision (choose one)
- Concluding Statement (choose one)
____ There is sufficient sample evidence to support the claim that ______ than 20% of Skittles are purple.
_____ There is not sufficient sample evidence to support the claim that ______ than 20% of Skittles are purple.
- Suppose we want to test the claim that the mean wait time for a GrubHub delivery is more than 40 minutes.
- Claim:
\( \mu > 40 \) - Null hypothesis \(H_0\):
\( \mu \leq 40 \) - Alternate hypothesis \(H_A\):
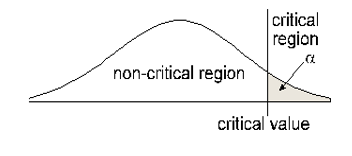
\( \mu > 40 \) - Type of test:
Right-Tailed - Draw a graph of the critical (rejection) region.
Claim has \( =,\ \ \le,\ \ \geq\) Claim has \( \neq,\ <,\ \ >\) Claim is null hypothesis Claim is alternate hypothesis
Symbol for the Alternate Hypothesis Type of Test \(\neq\) Two-tailed \(<\) Left-tailed \(>\) Right-tailed
- Claim:
- Let’s say we want to test the claim that the percentage of all students who eat sushi at least once per week is less than 27%.
- Claim:
\(p < 0.27\) - \(H_0\):
\(p \geq 0.27\) - \(H_A\):
\(p < 0.27\) - Type of test:
Left-Tailed - Draw a graph of the critical (rejection) region.
- Suppose we reject the null hypothesis. Write a concluding statement.
There is sufficient sample evidence to support the claim that the percentage of all students who eat sushi at least once per week is significantly less than 27%.
Claim has \( =,\ \ \le,\ \ \geq \) Claim has \( \neq,\ <,\ \ > \) Claim is null hypothesis Claim is alternate hypothesis Reject the null hypothesis “There is sufficient sample evidence to reject the claim that…” “There is sufficient sample evidence to support the claim that…” Fail to reject the null hypothesis “There is not sufficient sample evidence to reject the claim that…” “There is not sufficient sample evidence to support the claim that…”
- Claim:
- Golf balls must weigh 1.615 ounces to receive a top rating in the industry. One company claims their competitor’s golf balls do not weigh 1.615 ounces.
- Claim:
\(\mu \neq 1.615\) - \(H_0\):
\(\mu = 1.615\) - \(H_A\):
\(\mu \neq 1.615\) - Type of test:
Two-Tailed - Draw a graph of the critical (rejection) regions.
- Suppose we fail to reject the null hypothesis. Write a concluding statement.
There is not sufficient sample evidence to support the claim that the competitor’s golf balls do not weigh 1.615 ounces.
Claim has \( =,\ \ \le,\ \ \geq \) Claim has \( \neq,\ <,\ \ > \) Claim is null hypothesis Claim is alternate hypothesis Reject the null hypothesis “There is sufficient sample evidence to reject the claim that…” “There is sufficient sample evidence to support the claim that…” Fail to reject the null hypothesis “There is not sufficient sample evidence to reject the claim that…” “There is not sufficient sample evidence to support the claim that…”
- Claim:
_____Is your p-value less than alpha? Then, assuming our null hypothesis is true, the number of blue M&M’s in your sample is surprising. It had a low probability of occurring.
_____Is your p-value greater than or equal to alpha? Then, assuming our null hypothesis is true, the number of blue M&M’s in your sample is not that surprising. The probability is above the threshold we set.
____ Reject the null hypothesis: p-value < alpha
____ Fail to Reject the null hypothesis: p-value ≥ alpha
Hypothesis Testing: Skittles
_____Is your p-value less than alpha? Then, assuming 20% of Skittles are purple, the number of purple Skittles in your sample is surprising. It had a low probability of occurring.
_____Is your p-value greater than or equal to alpha? Then, assuming 20% of Skittles are purple, the number of purple Skittles in your sample is not that surprising. The probability is above the threshold we set.
____ Reject the null hypothesis and the assumption that 20% of Skittles are purple: p-value < alpha
____ Fail to Reject the assumption that 20% of Skittles are purple: p-value ≥ alpha