Unit 2 Probability
Review
- The General Motors Corporation wants to conduct a test of a new model of Corvette. A pool of 200 drivers has been recruited, 80 of whom are left-handed. When the first person is selected from this pool, what is the probability of not getting a left-handed driver?
\(\begin{equation} P(\text { NOT left-handed })=\frac{120}{200}=\frac{3}{5}=0.6 \end{equation}\) - Two psychologists surveyed 478 elementary children in Michigan. They asked students whether their primary goal was to get good grades, to be popular, or to be good at sports. Below is a contingency table giving counts of the students by their goals and demographic setting of their school: rural, suburban, or urban.. Complete the table and answer the questions.
Grades Most Important Popularity Most Important Sports Most Important Total Number Rural 57 50 42 149
Suburban 87 42 22 151
Urban 103 49 26 178
Total Number 247
141
90
478
For one randomly selected student, find:
- P(Rural) =
\(\begin{equation} \frac{149}{478} \approx 0.3117 \end{equation}\) - P(Sports) =
\(\begin{equation} \frac{90}{478} \approx 0.1883 \end{equation}\) - P(Suburban and Popularity) =
\(\begin{equation} \frac{42}{478} \approx 0.0879 \end{equation}\) - P(Suburban or Popularity) =
\(\begin{equation} \frac{250}{478} \approx 0.5230 \end{equation}\) P(Suburban) + P(Popularity) - P(Suburban AND Popularity) \(\begin{equation} =\frac{151}{478}+\frac{141}{478}-\frac{42}{478}=\frac{250}{478} \approx 0.5230 \end{equation}\)
- P(Popularity | Rural) =
\(\frac{50}{149} \approx 0.3356\) - P(Rural | Grades) =
\(\frac{57}{247} \approx 0.2308\)
- P(Rural) =
- According to cancer.org, there is about a 25% success rate for those who try to stop smoking through medication alone. Find the probability that for 8 randomly selected smokers who use medication, they all successfully quit smoking.
\((.25)^{8}=0.000015\)
- If Knoxville has an annual robbery rate of 0.23%, find the probability that among 3 randomly selected residents, all have been robbed during a given year. (The population of Knoxville is about 183,000.)
Data from http://www.neighborhoodscout.com/tn/knoxville/crime/
\((.0023)^{3}=0.000000012\)
- Below is a table showing the number of people with various levels of education in 5 countries.
Post-graduate Some College Some High School Primary or Less No Answer Total Number China 7 315 671 506 3 1502 France 69 388 766 309 7 1539 India 161 514 622 227 11 1535 U.K. 58 207 1240 32 20 1557 USA 84 486 896 87 4 1557 Total Number 379 1910 4195 1161 45 7690 If we select someone randomly from the survey, what is the probability the person…
- is from the US?
\(\frac{1557}{7690}=0.2025\) - had some education but no college?
Disjoint P(some HS OR Primary or Less) \(=\frac{4195}{7690}+\frac{1161}{7690}-\frac{0}{7690}=\frac{5356}{7690}=0.6965\)
- is from France or did some post-graduate study?
P(France) + P(Post Grad) - P(France AND Post Grad) = \(\frac{1539}{7690}+\frac{379}{7690}-\frac{69}{7690}=\frac{1849}{7690}=.2404\)
- is from the US?
- Complete the statement: \(P(A)+P(\overline{A})=\)
1 - Eye Color: Groups of 5 babies are randomly selected. In each group, the random variable x is the number of babies with green eyes.
x values Probability P(x) 0 0.528 1 0.360 2 0.098 3 0.013 4 0.001 5 0+ - Does it meet the requirement for a probability distribution? Explain
\(\mathrm{Yes.} \sum P(x)=1 \text { all } P(x) \leq 1 \text{ and } \geq 0\)
- Expected Value: E(x) =
.599 Mean \(\mu= \) .599 - Variance: \(\sigma^{2}= \)
.5262 Standadard Deviation \(\sigma = \) \(\sqrt{.5262}=.7254\) - Minimum Usual Value:
-.8518 Maximum Usual Value: 2.049 - Would it be unusual to have 0 babies out of 5 randomly selected babies with green eyes?
No. 0 is between max and min of usual values (-.8518, 2.049)
- Would it be unusual to have 2 babies out of 5 randomly selected babies with green eyes?
No. 2 is between (-.8518, 2.049) . Also, P(x = 2) = .098 is not less than .05.
- Probability of exactly 2 green eyed babies:
\(P(x=2)=.098\) - Probability of 3 or more green eyed babies:
\(P(x \geq 3)=.013+.001+0^{+}=.014\) - Probability of at least 1 green eyed baby:
\(P(x \geq 1)=1-P(x=0)=1-.528=.472\) - Probability of at most 1 green eyed babies:
\(P(x \leq 1)=P(x=0)+P(x=1)=.528+.360=.888\) - Probability of no more than 1 green eyed babies:
\(P(x \leq 1)=.888\)
Find the following probabilities (assuming 5 randomly selected babies)
- Does it meet the requirement for a probability distribution? Explain
- Find the probability of getting exactly 3 correct responses among 5 different requests from AT&T directory assistance. Assume in general, AT&T is correct 90% of the time.
n =
5 x = 3 p = 0.9 q = 0.1 \(P(x)=\frac{5 !}{2 ! 3 !}(0.9)^{3}(0.1)^{2}=0.073\)
- Your brother baked a large batch of cookies. He put chocolate chips in 45% of the cookies. He randomly selects 10 cookies to give to a friend. What is the probability that 6 of the cookies contain chocolate chips?
\(n : 10, p : 0.45 \quad P(x=6)=0.1595678\)
- How would you work each of the following problems using Technology?
60% of the class likes chocolate. If 20 students are randomly selected, find the probability:
n = 20 p = 0.60 Words Probability Statement Calculated Probability Unusual (Yes or No) a. 4 like chocolate \(P(x=4)\)
0.0003
Yes
b. No more than 5 like chocolate \(P(x \leq 5)\)
0.0016
Yes
c. 7 or more like chocolate \(P(x \geq 7)\)
0.9935
No
d. More than 7 like chocolate \(P(x>7)\)
0.9790
No
e. Less than 13 like chocolate \(P(x<13)\)
0.5841
No
- What is the mean and standard deviation for the probability distribution (of 20 randomly selected students from a class in which 60% of the students like chocolate)?
Mean:
12 Standard Deviation: 2.2 - The average life expectance of a specific brand of tires is 40,000 miles and has a mound shaped distribution (bell-shaped). The standard deviation is 7,500 miles.
- Construct and label a bell curve representing the distribution.
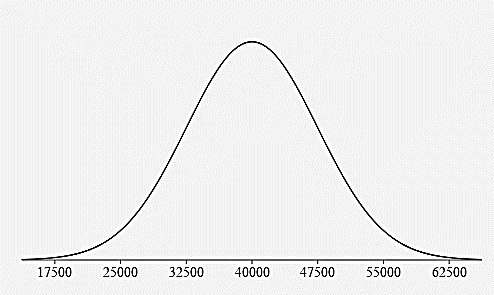
- Estimate the percentage of all tires that have a life expectancy:
Below 32,500 miles?
\(0.15\%+2.35\%+13.5\%=16\%\) 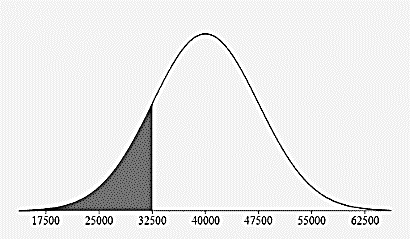
Above 25,000 miles?
\(97.5\% = 13.5\% + 34\% + 34\% 13.5\% + 2.35\% + 0.15\%\) 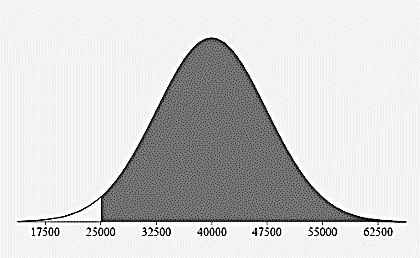
Between 40,000 and 55,000 miles?
\(47.5\%=34\% + 13.5\%\) 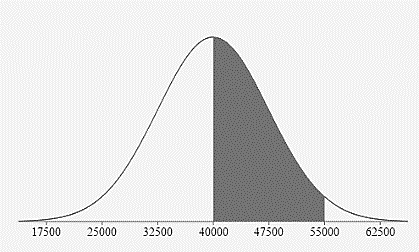
- According to dairymoos.com, the mean weight of an adult cow is 1500 lb. Assuming the weights are normally distributed with a standard deviation of 180lb.
- Construct and label a bell curve representing the distribution.
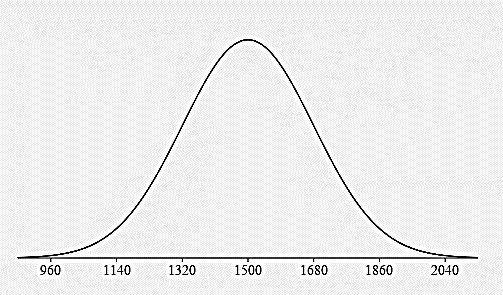
- Estimate the percentage of adult cows that weigh:
Between 1320 lbs and 1860 lbs?
\(81.5\%=34\% + 34\% + 13.5\%\) 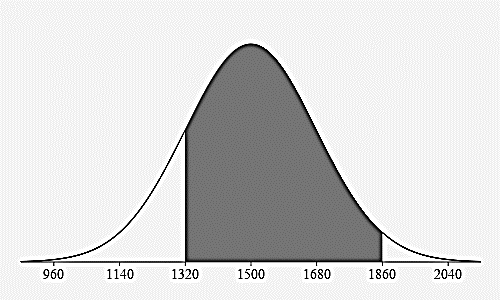
Less than 1500 lbs?
\(50\%=0.15\% + 2.35\% + 13.5\% + 34\%\) 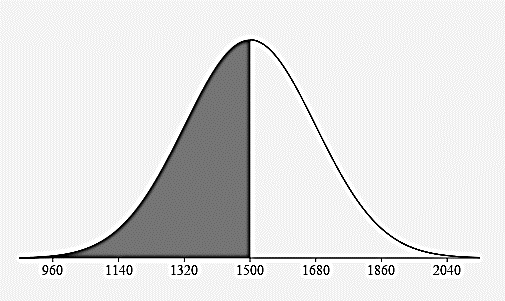
More than 1680 lbs?
\(16\%=13.5\% + 2.35\% + 0.15\%\) 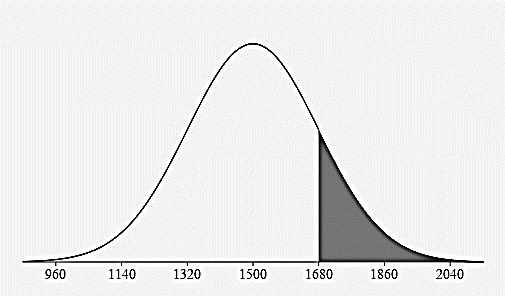
z-Scores
- Heights of the members of a high school sport have a bell-shaped distribution with a mean of 161cm and a standard deviation of 7cm.
- Find a z score for a team member that is 156 cm tall:
\( z_{156}=\frac{156-161}{7}=-0.71\) What does this z-score mean in words:
The team member’s height of 156 cm is 0.71 standard deviations below the mean of 161 cm. - Find a z score for a team member that is 170 cm tall:
\(z_{170}=\frac{170-161}{7}=1.29\) What does this z-score mean in words:
The team member’s height of 170 cm is 1.29 standard deviations above the mean of 161 cm. - Find a z score for a team member that is 161 cm tall:
\(z_{161}=\frac{161-161}{7}=0\) What does this z-score mean in words:
The team member’s height of 161 cm is 0 standard deviations above or below the mean of 161 cm.
- Heights of the members of a high school sport have a bell-shaped distribution with a mean of 161cm and a standard deviation of 7cm.
- According to dairymoos.com, the mean weight of an adult cow is 1500 lb. Assuming the weights are normally distributed with a standard deviation of 180lb.
- Construct and label a bell curve representing the distribution.