2.5 Empirical Rule
Calculating z-scores
What is a z-score?
What is the formula for calculating the z-score within a normally distributed population?
- Compare the following z-scores and interpret the results. The mean ACT score at Lincoln High School is 24 with a standard deviation of 4. The mean SAT score is 1100 with a standard deviation of 80. If Alice scores 32 on the ACT and Bob scores 1200 on the SAT, which has a better score, relative to the sample data?
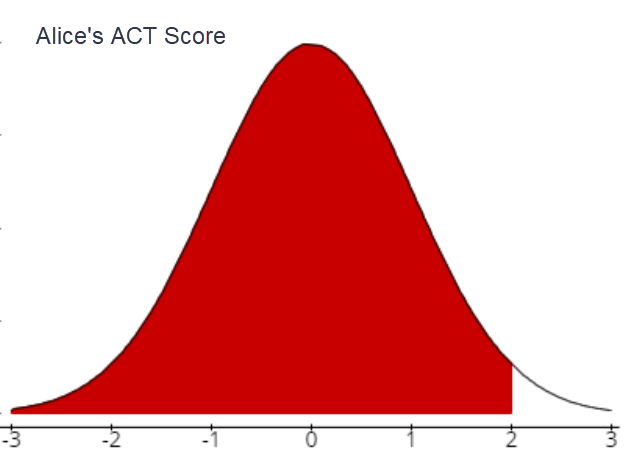
- Alice's score on the ACT
- Alice's z-score:
\(\mu=24 ; \quad \sigma=4 ;\quad x=32 ;\quad Z=\frac{x-\mu}{\sigma}\)
\(Z_{32}=\frac{32-24}{4}=2.00\)
- What does this z score mean (in words)?
Alice’s ACT score of 32 is 2 standard.deviations above the population mean of 24.
- Sketch a bell curve and mark the score on the curve
- Alice's z-score:
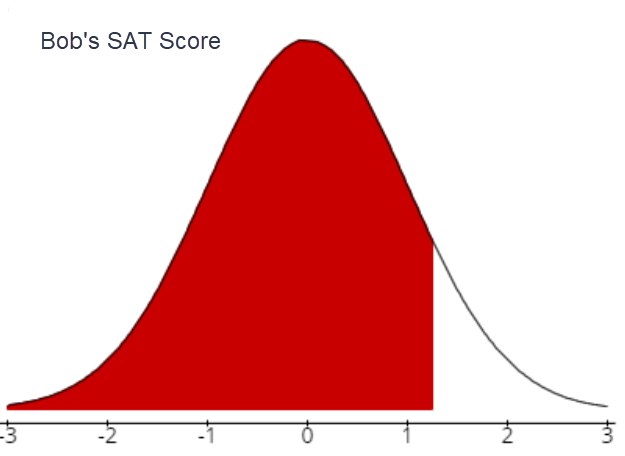
- Bob's score on the SAT
- Bob's z-score: \(\mu=1100 ; \quad \sigma=80 ; \quad x=1200\)
\(Z_{1200}=\frac{1200-1100}{80}=1.25\)
- What does this z score mean (in words)?
Bob’s SAT score of 1200 is 1.25 standard deviations above the population mean of 1100.
- Sketch a bell curve and mark the score on the curve
- Bob's z-score: \(\mu=1100 ; \quad \sigma=80 ; \quad x=1200\)
- Relative to other students in the population, which score is better?
Alice’s relative score is better. She is 2 standard deviations above the mean. Bob’s score is only 1.25 standard deviations above the mean.
- Alice's score on the ACT
-
IQ SCORES: IQ scores have a bell-shaped distribution with a mean of 100 (\(\mu = 100\)) and a standard deviation of 15 (\(\sigma = 15\)). What percentage of IQ scores are:
- Between 70 and 130?
\(13.5+34+34+13.5=95 \%\) - Below 115?
\(0.15+2.35+13.5+34+34=84 \%\) - Above 70?
\(13.5+34+34+13.5+2.35+0.15=97.5 \%\) - Between 85 and 130?
\(34+34+13.5=81.5 \%\) - Below 145?
\(0.15+2.35+1.35+34+34+13.5+2.35=99.85 \%\) - Usual Values are between and .
\(70 \text { and } 130\) - Unusual Values are below or above .
\(70 \text { and } 130\)
An unusual event has less than a 5% chance of occurring. Events that fall more than two standard deviations away from the mean are considered unusual.
Give the formulas for the following:
Mimimum usual value:
\(\mu-2 \sigma=100-2(15)=70\) Maximum usual value:
\(\mu+2 \sigma=100+2(15)=130\) - Between 70 and 130?
- Sketchy Milk Company: A dairy fills gallons of milk with a mean of 125.0 fluid ounces and a standard deviation of 0.3 fluid ounces. The volumes have a bell-shaped distribution. Using the empirical rule, what is the approximate percentage of milk amounts:
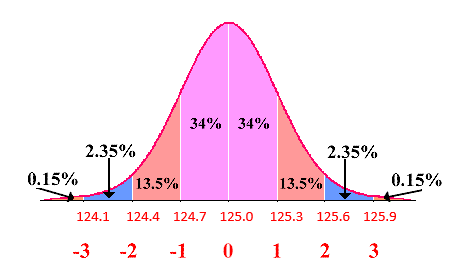
- Between 124.4 fluid ounces and 125.6 fluid ounces?
\(13.5+34+34+13.5=95 \%\) - Below 124.7 fluid ounces?
\(0.15+2.35+13.5=16 \%\) - Above 124.7 fluid ounces?
\(34+34+13.5+2.35+0.15=84 \%\) - Between 125.0 fluid ounces and 125.9 fluid ounces?
\(34+13.5+2.35=49.85 \%\) - Usual values are between and ?
\(124.4 \text { and } 125.6\) Minimum usual value: \(\mu-2 \sigma=125.0-2(0.3)=124.4\) fluid ounces
Maximum usual value: \(\mu+2 \sigma=125.0+2(0.3)=125.6\) fluid ounces
- Unusual Values are below or above .
\(124.4 \text { and } 125.6\)
- Between 124.4 fluid ounces and 125.6 fluid ounces?
- Giraffes have a mean height of 18 feet with a standard deviation of 0.8 feet. African elephants have a mean height of 10.6 feet with a standard deviation of 1.2 feet.
- Calculate the z-score for a giraffe that is 15 feet tall.
\(z=\frac{15-18}{0.8}=-3.75\)
- What does this z-score tell you about the height of a 15-foot giraffe?
It is unusually short. The height is 3.75 standard deviations below the mean.
- Calculate the z-score for an elephant that is 15 feet tall.
\(z=\frac{15-10.6}{1.2}=3.67\)
- What does this z-score tell you about the height of a 15-foot elephant?
It is unusually tall. The height is 3.67 standard deviations above the mean.
- Calculate the height of a giraffe whose height is 2.3 standard deviations above the mean.
\(x=18+(2.3)(0.8)=19.84\) feet
- Calculate the height of an elephant whose height has a z-score of -1.6.
\(x=10.6+(-1.6)(1.2)=8.68\) feet
- Is a 16.5-foot tall giraffe considered unusual?
No. The minimum usual value is 18 - 2(0.8) = 16.4 feet.
- What is the range for usual heights of African elephants?
8.2 feet to 13 feet
- Calculate the z-score for a giraffe that is 15 feet tall.
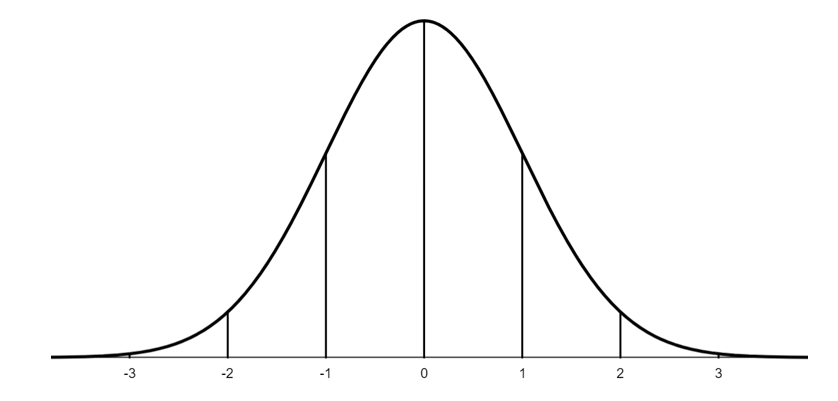
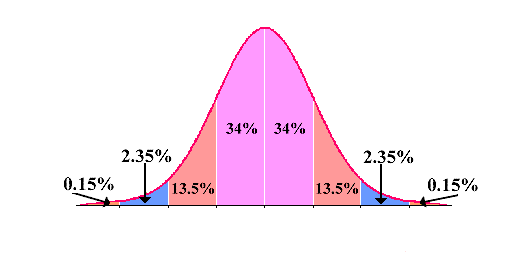
The Empirical Rule for Bell Shaped Distributions
In a bell-shaped distribution of data:
What percent of the values fall within 1 standard deviation of the mean?
What percent of the values fall within 2 standard deviations of the mean?
What percent of the values fall within 3 standard deviations of the mean?
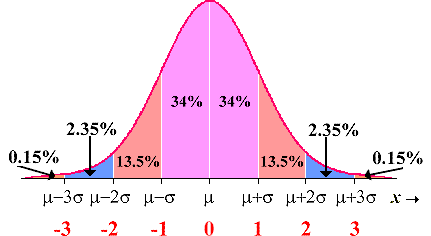
Label the percentages on the bell-shaped distribution: