3.3 Central Limit Theorem
- Extra room is left at the top of each bottle for a maximum of 2.25 liters of soda before the bottle overflows and causes a sticky mess on the assembly line. What percent of the bottles will be overfilled by a correctly calibrated machine?
P( )=
\(P(x>2.25)=\) = 0.00000211 Write as a percentage:
0.000211% - If the plant produces 1,500,000 bottles per year, how many times per year do you expect to clean up a spill from a correctly calibrated machine?
0.00000211(1,500,000)=3.315 We expect to clean up a spill 3 times per year. - The company prefers that their 2-liter bottles contain at least 1.95 liters of soda. You are in charge of quality control. You take sample bottles off the assembly line to measure the amount of soda and decide if the machine needs to be recalibrated. The assembly line must be shut down for several hours in order to recalibrate the machine. If you select one bottle from the assembly line with a correctly calibrated machine, what is the probability it will contain less than 1.95 liters?
P( )=
This is the percentage of bottles that will contain less than 1.95 liters with a correctly calibrated machine.\(P(x<1.95)=\)0.0808 - If the bottling plant is open 300 days per year and you randomly select 1 bottle each day to decide whether to recalibrate that day, how many times per year would you expect to have to recalibrate a correctly calibrated machine?
0.0808*300 = 24.24 - Load the data set “Cola Bottling Company” from My Group in StatCrunch. Under Applets, select Sampling Distributions. Click the radio button to use the population “From data table” and from the drop-down menu for Values in: select Distribution of Individual Bottles. Then Compute! We’re going to compare different sampling distributions. We’ll start with a sample size of 1. In the box for sample size, adjust that number to 1. Click “1 time” at the top to select one bottle from the assembly line. Record the amount of cola in your sampled bottle:
- The plant foreman says you must recalibrate the machine if the sample bottle contains less than 1.95 liters. Based on your randomly selected bottle from the correctly calibrated machine, will you have to go through the recalibration process? Yes or No?
- How many students in our class randomly sampled a bottle with less than 1.95 liters and will have to go through the recalibration process?
- Simulate taking a sample of 1 bottle over and over again. Click “1000 times” (or more!). What are the mean and standard deviation for the Sample Means when the sample size is 1 bottle? n = Mean: _______________ Standard deviation: _____________ Note that this is the same as the original population distribution.
- You decide it might be better to take a larger sample of bottles off the assembly line to decide whether to recalibrate. Click “Reset” at the top of the Sampling Distributions applet. Change the sample size to 4. Click “1 time” at the top to select a random sample of 4 bottles. Record the mean of your sample:
- Is the mean of your sample less than 1.95 liters?
- How many students in our class have a sample mean less than 1.95 liters and will have to go through the recalibration process?
- Simulate taking a sample of 4 bottles over and over again. Click “1000 times” (or more!). What are the mean and standard deviation for the Sample Means when the sample size is 4 bottles? n = Mean: _______________ Standard deviation: _____________
- If you select four bottles from the assembly line with a correctly calibrated machine, what is the probability the mean amount of cola will be less than 1.95 liters? (Use the Normal Calculator)
- If the bottling plant is open 300 days per year and you randomly select a sample of 4 bottles each day to decide whether to recalibrate that day, how many times per year would you expect to have to recalibrate a correctly calibrated machine?
- You decide to randomly select a sample of 9 bottles off the assembly line and test if their mean is less than 1.95 liters. Click “Reset” at the top of the Sampling Distributions applet. Change the sample size to 9. Click “1 time” at the top to select a random sample of 9 bottles. Record the mean of your sample:
- How many students in our class have a sample mean less than 1.95 liters and will have to go through the recalibration process?
- Simulate taking a sample of 9 bottles over and over again. Click “1000 times” (or more!). What are the mean and standard deviation for the Sample Means when the sample size is 9 bottles? n = Mean: _______________ Standard deviation: _____________
- If you select nine bottles from the assembly line with a correctly calibrated machine, what is the probability the mean amount of cola will be less than 1.95 liters? (Use the Normal Calculator)
- If the bottling plant is open 300 days per year and you randomly select a sample of 9 bottles each day to decide whether to recalibrate that day, how many times per year would you expect to have to recalibrate a correctly calibrated machine?
- What do you think is the best sampling method for making a decision about machine recalibrating? Why? Explain fully.
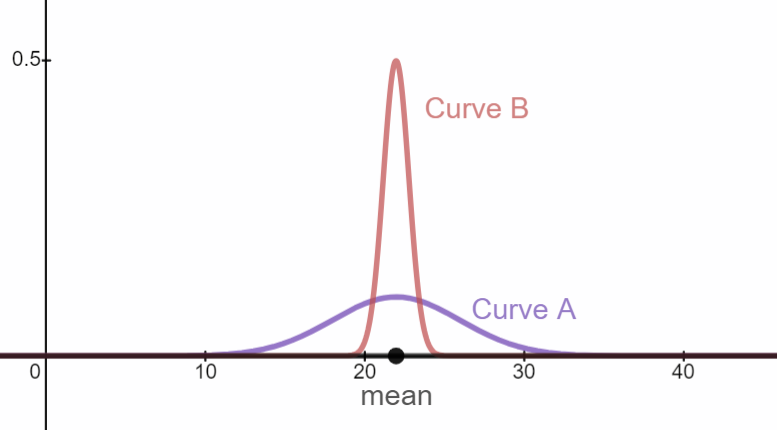
- Identify the mean of Curve A and the mean of Curve B. What do you notice?
\(\mu_{A}=22\)
\(\mu_{B}=22\)
Both curves have the same mean.
- Compare the standard deviation of Curve A and Curve B. What do you notice?
The standard deviation of Curve A is greater than the standard deviation of Curve B.
The standard deviation for the distribution of sample means is less than the standard deviation of the population the samples were selected from.
- Give an explanation for your observations in the previous two questions.
The means are the same in the two curves because the mean of each sample will be close to the mean of the population. The standard deviation for the distribution of sample means is less than the distribution of the population because an extreme value randomly selected from one of the tails of the population curve is averaged together with 24 other values to produce the mean of the sample. Each sample mean will be close to the population mean and so the spread of sample means is less than the spread of individuals.
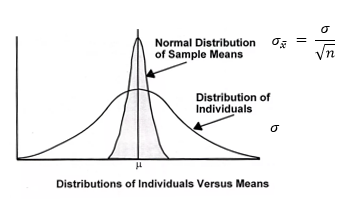
- A distribution of sample means approaches a normal distribution.
- Samples must be from a normally distributed population, or the sample size must be greater than 30 (n > 30).
- The distribution of sample means has the same mean as the population.
- The standard deviation for the distribution of sample means is always less than the standard deviation population.
- The standard deviation for the distribution of sample means is \(\frac{\sigma}{\sqrt{n}}\).
- Birth weights in the United States have a distribution that is approximately normal with a mean of 3369g and a standard deviation of 567g (American Journal of Epidemiology).
- If one baby is randomly selected, find the probability that its birth weight is between 3360 grams and 3400 grams.
\(\mu = \)
3369 \(\sigma = \) \(567\) \(P(3360\leq x\leq3400)=0.0281\) or 2.81%
- If 25 babies are randomly selected, find the probability that their mean birth weight is between 3360g and 3400g.
\(\mu = \)
3369 \(\sigma = \) \(\frac{567}{\sqrt{25}}=113.4\) \(z_{3360}=\frac{3360-3369}{113.4} \approx-0.0794\) \(z_{3400}=\frac{3400-3369}{113.4} \approx 0.2734\) \(P(3360 \lt \overset-x \lt 3400)=P(-0.08 \lt z \lt 0.27)=0.1393\)
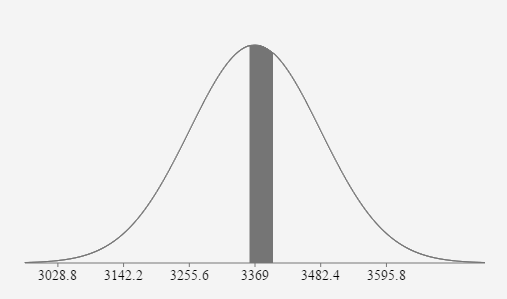
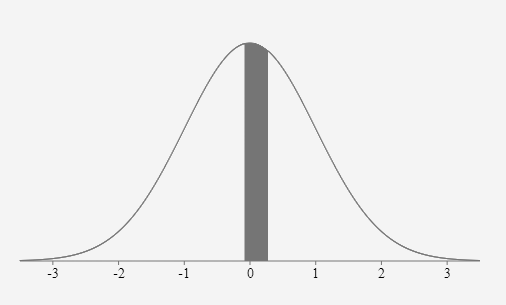
If 25 babies are randomly selected, the probability their mean birth weight is between 3360g and 3400g is approximately equal to 0.1393 or 13.93%.
- If one baby is randomly selected, find the probability that its birth weight is between 3360 grams and 3400 grams.
- Pulse Rates of adult men are normally distributed with a mean of 73 bpm and a standard deviation of 8 bpm.
- If one man is randomly selected, find the probability that his pulse rate is less than 72.5 beats per minute.
\(\mu = \)
73 bpm \(\sigma = \) \(8\) \(P( x < 72.5)=0.4751\) or 47.51%
- If 10 adult males are randomly selected, what is the probability their mean pulse rate will be less than 72.5 bpm.
\(\mu = \)
73 bpm \(\sigma = \) \(\frac{8}{\sqrt{10}} \approx 2.53 \text{ bpm}\) \(z_{72.5}=\frac{72.5-73}{\left(\frac{8}{\sqrt{10}}\right)} \approx-0.1976\) \(P(\overline{x} \lt 72.5)=P(z \lt -0.1976)=0.4217\)
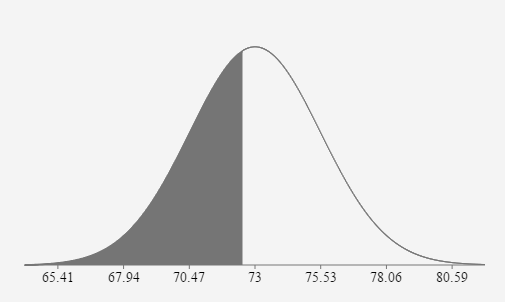
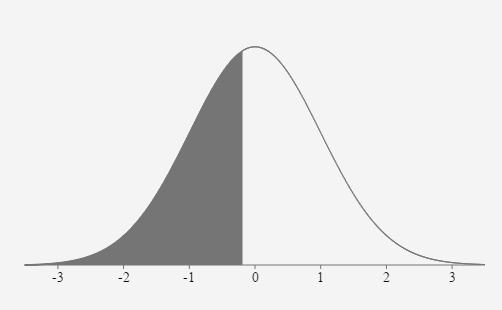
If 10 adult males are randomly selected, the probability their mean pulse rate is less than 72.5 bpm is approximately equal to 0.4217 or 42.17%.
- If one man is randomly selected, find the probability that his pulse rate is less than 72.5 beats per minute.
-
Problem
The mean amount of cash students at PSCC carry in their pocket is $15 and the standard deviation is $9. If 40 students are randomly selected, what is the probability the mean amount of cash in their pocket is greater than $18?
Type of Probability Problem
Normal distribution: use Normal Calculator
- One individual: use given standard deviation
- Sample mean: adjust standard deviation using \(\frac{\sigma}{\sqrt n}\)
Binomial distribution: use Binomial Calculator
Sample Mean Evidence and Result
How did you know the type of probability problem?
Calculations:
\(\mu=15\\\sigma=9/\sqrt{40}\\P(x>18)=0.0175\)
-
Problem
People in the U.S. between the ages of 25 and 34 years old spend an average of $1630 per year on eating out. Money spent on food away from home is normally distributed with a standard deviation of $425. What is the probability that a randomly selected 25-34-year-old spent more than $1800 on eating out last year?
Type of Probability Problem
Normal distribution: use Normal Calculator
- One individual: use given standard deviation
- Sample mean: adjust standard deviation using \(\frac{\sigma}{\sqrt n}\)
Binomial distribution: use Binomial Calculator
One Individual Evidence and Result
How did you know the type of probability problem?
Calculations:
\(\mu=1630\\\sigma=425\\P(x>1800)=0.3446\)
-
Problem
The mean salary for a Tennessee public school teacher is $54000 with a standard deviation of $5250. If you randomly select the salaries of 49 Tennessee public school teachers, what is the probability the sample mean is less than $50,000?
Type of Probability Problem
Normal distribution: use Normal Calculator
- One individual: use given standard deviation
- Sample mean: adjust standard deviation using \(\frac{\sigma}{\sqrt n}\)
Binomial distribution: use Binomial Calculator
Sample Mean Evidence and Result
How did you know the type of probability problem?
Calculations:
\(\mu=54,000\\\sigma=5250/\sqrt{49}\\P(x<50,000)=0.00000005\)
-
Problem
Delta flights are on time 84% of the time. Suppose 10 flights are randomly selected. What is the probability that more than 8 flights are on time?
Type of Probability Problem
Normal distribution: use Normal Calculator
- One individual: use given standard deviation
- Sample mean: adjust standard deviation using \(\frac{\sigma}{\sqrt n}\)
Binomial distribution: use Binomial Calculator
Binomial Calculator Evidence and Result
How did you know the type of probability problem?
Calculations:
\(p=0.84\\n=10\\P(x>8)=0.5080\)
-
Problem
LED light bulbs last an average of 32,500 hours with a standard deviation of 8750 hours. If you randomly purchase an LED light bulb, what is the probability it will last at least 50,000 hours?
Type of Probability Problem
Normal distribution: use Normal Calculator
- One individual: use given standard deviation
- Sample mean: adjust standard deviation using \(\frac{\sigma}{\sqrt n}\)
Binomial distribution: use Binomial Calculator
One Individual Evidence and Result
How did you know the type of probability problem?
Calculations:
\(\mu=32,500\\\sigma=8750\\P(x\geq 50,000)=0.0228\)
-
Problem
In a recent study, the mean age of tablet users is 34 years old. Suppose the standard deviation is 15 years. Take a sample of size n = 100. Find the probability that the sample mean age is less than 30 years.
Type of Probability Problem
Normal distribution: use Normal Calculator
- One individual: use given standard deviation
- Sample mean: adjust standard deviation using \(\frac{\sigma}{\sqrt n}\)
Binomial distribution: use Binomial Calculator
Sample Mean Evidence and Result
How did you know the type of probability problem?
Calculations:
\(\mu=34\\\sigma=15/\sqrt{100}\\P(x<30)=0.0038\)
At a cola bottling plant, a machine fills 2-liter soda bottles. The machine is calibrated to dispense 2.02 liters in each bottle. Actual quantities dispensed vary and the amounts are normally distributed with a standard deviation of 0.05 liters.
ACT scores for high school seniors at a large school district are normally distributed with a mean of 22 and a standard deviation of 4. Compare the two distribution curves given below.
Description of Curve A: Every student is represented on the curve as an individual and the entire population is represented.
Description of Curve B: Groups of 25 students are randomly selected from the population and the mean ACT of each group is represented on the curve.
The Central Limit Theorem:
Probability Decisions
Circle the little words in each problem that have big meaning!