Unit 2 Formula Sheet
Probability:
\(P(E)=\frac{ \text {Number of Outcomes in Event E} }{ \text {Total number of outcomes in the sample space }}\)
Probability of a Complement:
\(P(E')=1-P(E)\)
Probability of occurrence of both events A and B:
\(P(A\; \text {and} \;B)=P(A)\cdot P(\left.B\right|A)\)
\(P(A\; \text {and} \;B)=P(A)\cdot P(B)\) if \(A\; \text {and} \;B\) are independent
Probability of occurrence of either A or B:
\(P(A \; \text {or} \; B)=P(A)\;+\;P(B)\;-\;P(A \; \text {and} \; B)\)
\(P(A\; \text {or} \;B)=P(A)\;+\;P(B)\) if A and B are mutually exclusive
Mean (Expected Value) of a Discrete Random Variable:
\(\mu=\Sigma x\;P(x)\)
Population Parameters of a Binomial Distribution:
Mean: \(\mu=np\)
Variance: \(\sigma^2=npq\)
Standard Deviation: \(\sigma=\sqrt{npq}\)
Unit 2 StatCrunch Instructions
Mean and Standard Deviation of Probability Distribution
- Stat
- Calculators
- Custom
- Values in: Occurrences (usually var1)
- Weights in: Probabilities (usually var 2)
- Compute
Mean and Standard Deviation of a Binomial Distribution
Can’t do in StatCrunch—have to use formulas
Probabilities in Probability Distributions
- Stat
- Calculators
- Custom
- Values in: Occurrences (usually var1)
- Weights in: Probabilities (usually var 2)
- Compute
- Decide if:
Standard (<, >, =, ≤, ≥): Choose correct symbol, type in number
Between: smaller # first, bigger # second
- Compute
Constructing a Binomial Distribution
- Stat
- Calculators
- Binomial
- n= number of times trial repeated
- P: given probability
- Choose Standard or Between
- Enter correct symbol & type in number
- Compute
z-Score:
Population
\(z=\frac{x-\mu}\sigma\)
Sample
\(z=\frac{x-\bar{x}}{s}\)
Transforming a z-Score to an x-Value:
\(x=\mu+z \cdot \sigma\)
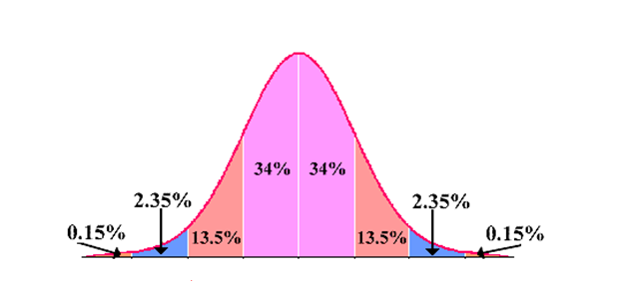
Empirical Rule:
(68-95-99.7 Rule) For symmetric, bell-shaped data sets
Frequency Distribution
Probability Distribution
Binomial Distribution
Normal Distribution