1.3 Measures of Center
Simplify. Round to the tenths place.
- \(\frac{32+97}2\)
\(129/2\)
\(64.5\)
- \(\frac{120+162+95+144+135+160+154}7\)
\(970/7\)
\(138.6\)
- \(\frac{3*55 + 9*65 + 4*75}{16}\)
\(1050/16\)
\(65.6\)
- \(\frac{75.8 - 53.9}2\)
\(21.9/2\)
\(11\)
- The mean weight of three dogs is 60 pounds. Which of the following is possible? (Answer yes or no.)
- One of the dogs weighs 100 pounds.
yes - None of the dogs weighs more than 60 pounds.
yes - Each dog weighs less than 60 pounds.
no - The dogs weigh 25, 55, and 110 pounds.
no - The dogs weigh 24, 52, and 104 pounds.
yes - Altogether the dogs weigh 180 pounds.
yes
- One of the dogs weighs 100 pounds.
- Shanita made a note of the weights of 8 baskets of fruit, but she spilled coffee on the fruit and the last number got smudged. If the average weight of the baskets is 12.5 pounds, how much was the smudged number? In other words, how much did the 8th basket of fruit weigh?
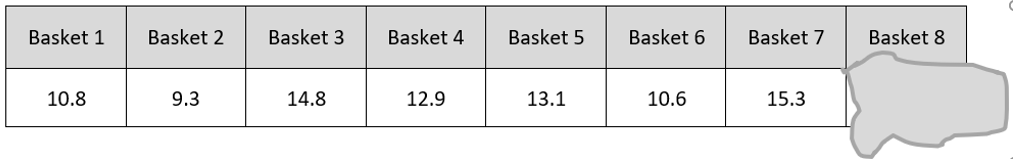
Sum of basket weights is \(8*12.5 = 100\), so basket 8 must be \(100 – 86.8 = 13.2\)
- Calculate the measures of central tendency for the following data.
- \(0, 3, 5, 6, 6, 8, 9, 10, 10, 10\)
mean:
\(67/10 = 6.7\) median:
\(7\) mode:
\(10\) midrange:
\(0+10/2=5\) - \(0, 3, 5, 6, 6, 8, 9, 10, 10, 100\)
mean:
\(157/10 = 15.7\) median:
\(7\) mode:
\(6, 10\) (bimodal) midrange:
\(0+100/2=50\)
- \(0, 3, 5, 6, 6, 8, 9, 10, 10, 10\)
- Calculate the measures of central tendency for the life expectancies from the given data.
Country Health $ per capita Obesity % Life expectancy Universal Healthcare Canada 5292 30.1 82 yes China 420 7.3 76 no Germany 5411 22.7 81 yes Italy 3258 23.7 84 yes Japan 3703 3.5 84 yes Mexico 677 27.6 77 no Norway 9522 24.8 82 yes Switzerland 9674 21 83 yes United Kingdom 3377 29.8 82 yes United States 9403 35 79 no
- Mean:
81 - Median:
82 - Position of the Median:
\(\frac{n+1}{2}=\frac{10+1}{2}=5.5\) - Mode:
82 - Midrange:
\(\frac{76+84}{2}=80\)
- Mean:
- Using the table in the problem above, calculate the measures of central tendency for the obesity percentages from the given data. Verify using technology.
- Mean:
22.55 - Median:
24.25 - Position of the Median:
\(\frac{n+1}{2}=\frac{10+1}{2}=5.5\) - Mode:
none - Midrange:
\(\frac{3.5+35}{2}=19.25\)
- Mean:
-
Calculate the semester grade point average (GPA) for the student with the following grades:
Course Credit Hours Grade Point Value for Grade Quality Points (Points x hours) ENGL 1020 3 C 2
6
MATH 1530 3 A 4
12
COMM 1010 3 B 3
9
BIOL 1110 4 C 2
8
COLL 1000 1 B+ 3.5
3.5
Total 14
38.5
\(\frac{38.5}{14}=2.75\)
- Find the estimated mean of the following data:
SECONDS FREQUENCY MIDPOINTS 5.0 – 5.9 5 5.45
6.0 – 6.9 8 6.45
7.0 – 7.9 10 7.45
8.0 – 8.9 7 8.45
9.0 – 9.9 3 9.45
- What is the estimated mean of the data?
7.30 By Formula: \(\overline{x}=\frac{\sum(f \cdot x)}{\sum f}=\frac{5(5.45)+8(6.45)+10(7.45)+7(8.45)+3(9.45)}{33}=\frac{240.85}{33} \approx 7.30\)
- What class holds the median number of seconds?
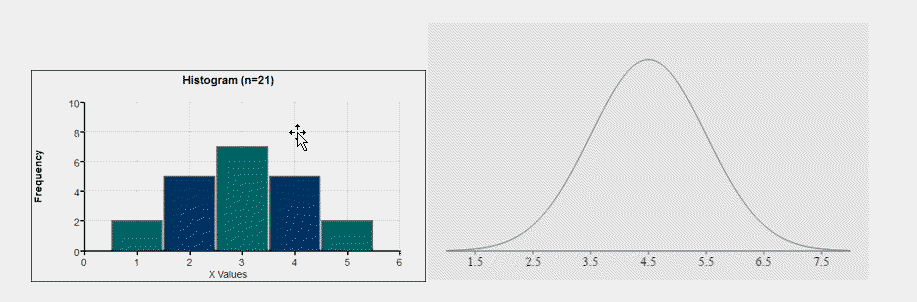
7.0-7.9 - What is the shape of the distribution?
Normal
- Below is a frequency distribution of the ages of riders for one ride on the Dahlonega Mine Train at Six Flags. Find the estimated mean of the following data:
Age of Riders, in years Number of Riders 10 - 14 5 15 - 19 6 20 - 24 9 25 - 29 15 30 - 34 3
- What is the estimated mean of the data?
22.7
- What class holds the median number of seconds?
Class 20-24 Position of the median: \(\frac{38+1}{2}=\frac{39}{2}=19.5\). Add frequencies until you reach 19.
- What is the shape of the distribution?
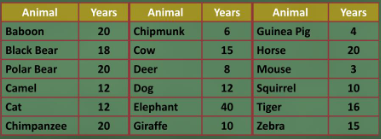
Skewed to the left - The stem-and-leaf plot displays the average life-span of a sample of animals. Key: 1|5 = 15 years
Stem Leaves 0 3 4 6 8 1 0 0 2 2 2 5 5 6 8 2 0 0 0 0 3 4 0 - Determine the median life-span of the sample data set.
\(\frac{12+15}{2}=\) 13.5 years - What is the mode of the sample data set?
20 years - Calculate the mean of the sample data set.
14.5 years
Give One/Get One
Make a list of everything you know about the measures of central tendency under My List. Think about meanings, formulas, special cases, advantages, disadvantages, etc. When prompted, discuss the terms with a classmate to add to your information and share your information with a classmate.
My List
Classmate's List
- Find the estimated mean of the following data:
Mean, Median, Mode, Midrange
What is an arithmetic mean?
What is the formula for the mean of a sample?
Describe in words what the formula for sample mean tells you to do:
What do each of the symbols in the formula represent?
Define the following measures of central tendency:
Median:
Mode:
Midrange
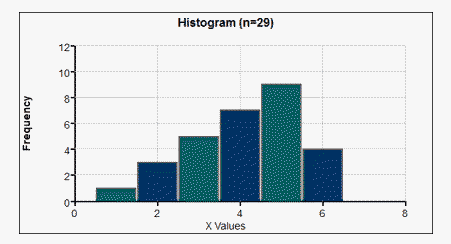
Shapes of Distributions
Symmetric (Normal):
Mean and Median are the same as Mode
Skewed To The Left (negatively skewed):
Mean and Median are to the LEFT of the Mode (Left Tail)
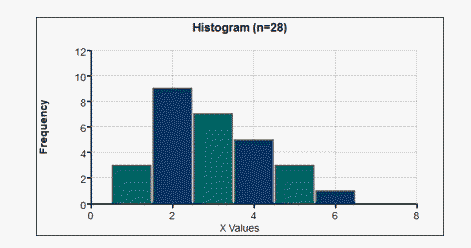
Skewed To The Right (positively skewed):
Mean and Median are to the RIGHT of the Mode (Right Tail)
Bimodal:
Two Modes
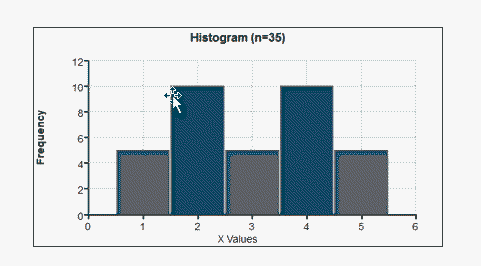
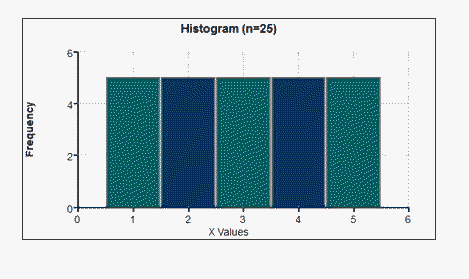
Uniform:
All frequencies are the same