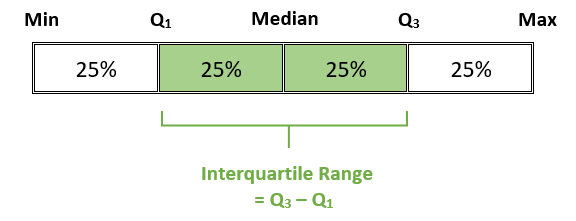
1.5 Measures of Relative Standing
The World's Highest-Paid Athletes 2023
Open the data set in Stat Crunch “World’s Highest Paid Athletes 2023”:
Source Sportico
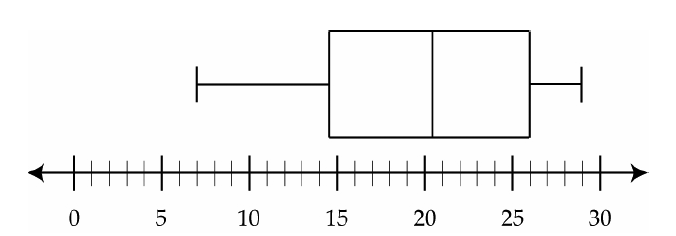
- Identify the following statistical measures for Total Earnings:
- Mean:
$112.39 M - Standard Deviation:
$54.96 M - Mode:
No mode - Minimum:
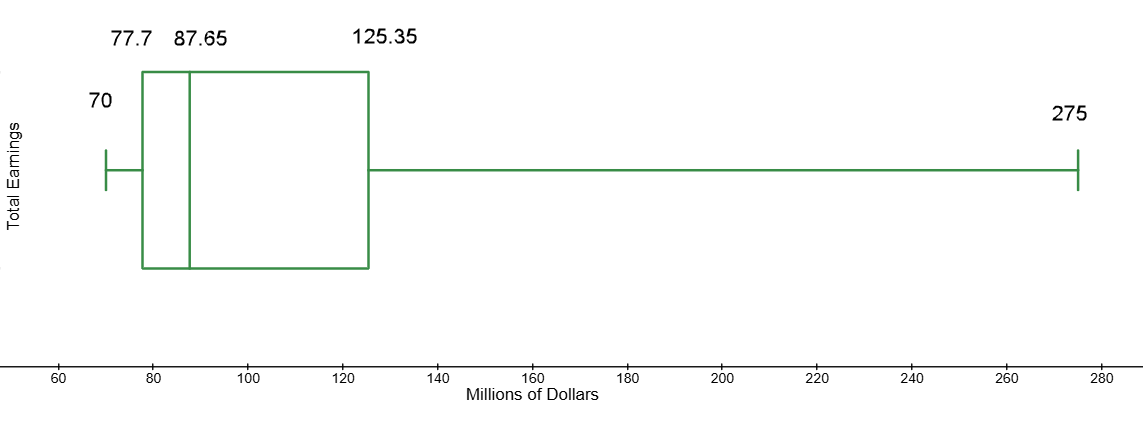
$70 M - Lower Quartile (Q1):
$77.7 M - Median:
$87.65 M - Upper Quartile (Q3):
$125.35 M - Max:
$275 M - Range:
$205 M
- Mean:
- Label the Quartiles on the box plot for Total Earnings:
- Determine the Inter-Quartile Range (IQR) for Total Earnings:
$47.65 M The range of the “middle” 50% of the data is called the interquartile range.
- How many of the world’s sixteen highest paid athletes for 2023 earned a total earnings greater than $125.35 million?
4 - How many of the world’s sixteen highest paid athletes for 2023 earned a total earnings less than $77.7 million?
4 - How many of the world’s sixteen highest paid athletes for 2023 earned a total earnings between $77.7 million and $87.65 million?
4 - How many of the world's sixteen highest paid athletes for 2023 had total earnings the same or lower than the 50th percentile?
8 - Lamar Jackson's total earnings is the 31st percentile for the world’s sixteen highest paid athletes for 2023. What does this mean?
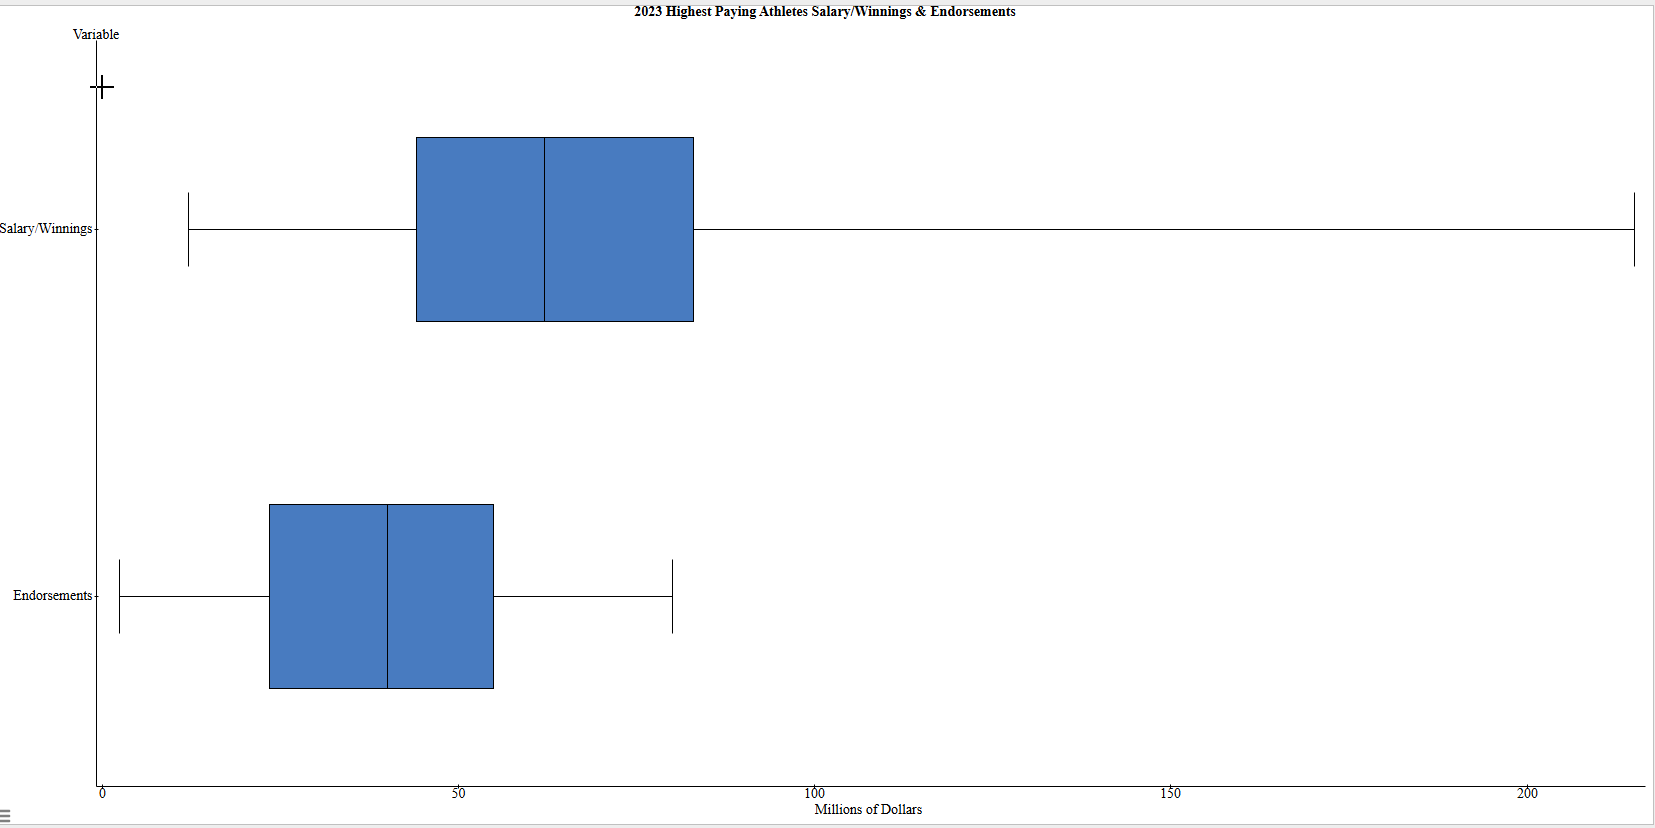
He earns higher than 31% of the highest paid athletes of 2023. - Use Stat Crunch to compare box plots for Salary/Winnings and Endorsements.
- Which data set has a higher median?
Salary/Winnings - Which data set has a greater range?
Salary/Winnings - In which data set do 50% of the athletes earn between $23.5 million and $55 million?
Endorsements - Which data set has more athletes earning less than $40 million?
Endorsements
- Which data set has a higher median?
Outliers:
In our course, outliers are defined as data values outside the boundaries of the max and min outlier critical values. Give the formulas for the outlier critical values:
Outlier Calculations:
- Lower Outlier Critical Value:
\(Q_1 - 1.5(IQR)\) - Upper Outlier Critical Value:
\(Q_3 + 1.5(IQR)\)
- What is the lower outlier critical value for the Total Earnings data set?
77.7 – 1.5(47.65) = $6.225 million - Are there any data values in the Total Earnings data set that are less than your answer to part (a)?
no - What is the upper outlier critical value for the Total Earnings data set?
125.35 + 1.5(47.65) = $196.825 million - Are there any data values in the Total Earnings data set that are greater than your answer to part (c)?
Yes--Ronaldo with $275 M and Rahm with $203 M
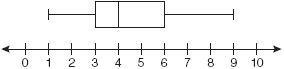
- Which cost is the upper quartile?
- What is the range of the costs of the water bottles?
- What is the median?
- Which cost represents the 100th percentile?
- How many water bottles cost between $14.50 and $26.00?
- How many water bottles cost less than $14.50?
$26
$22
$20.50
$29
6
3
- 25%
- 50%
- 75%
- 100%
a. 25%
- Which conclusion can be made using this plot?
- The second quartile is 600.
- The mean of the attendance is 400.
- The range of the attendance is 300 to 600.
- Twenty-five percent of the attendance is between 300 and 400.
iv. Twenty-five percent of the attendance is between 300 and 400.
- Of the following ranges of daily tickets sales, which range of ticket sales occurred more often than the others?
- 100-300
- 300-500
- 400-600
- 600-900
ii. 300-500 more than 25% of the daily ticket sales.
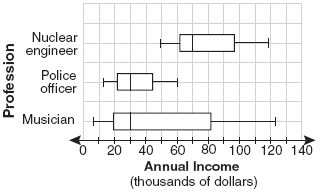
- Based on the box-and-whisker plots, which statement is true?
- The median income for nuclear engineers is greater than the income of all musicians.
- The median income for police officers and musicians is the same.
- All nuclear engineers earn more than all police officers.
- A musician will eventually earn more than a police officer.
ii. The median income for police officers and musicians is the same.
- At least how much income do 75% of musicians earn per year?
$20,000