Unit 4 Hypothesis Testing
7.3 Hypothesis Testing for the Mean
Step 4:
Identify Level of Significance and Degrees of Freedom
- Level of Significance: α
- Degrees of Freedom: n-1
Identify Test Statistic for Mean Claim:
- n = sample size
- s = sample standard deviation
- Degrees of freedom: n -1
- \(\overline{x}\) = sample mean
- \(\mu\) = population mean
- \(t=\frac{\overline{x}-\mu_{\overline{x}}}{\frac{s}{\sqrt{n}}}\)
Step 5: Using the P-value to Evaluate the Null Hypothesis
Definition of P-value: The probability of being as extreme, or more extreme, than your data, assuming H0 is correct.Step 6: Determine the Rejection Region
Step 7: Make One of Two Decisions About the Null Hypothesis
- If P-value \(\leq \alpha\):
- reject \(H_0\)
- Type I error: rejecting \(H_0\) when it is actually true
- If P-value \(> \alpha\):
- fail to reject \(H_0\)
- Type II error: failing to reject \(H_0\) when it is actually false
Step 8: Formulate a Conclusion About the Claim
| Null is the Claim | Alternate is the Claim | |
|---|---|---|
| Reject the Null | “There is sufficient sample evidence to reject the claim that…” | “There is sufficient sample evidence to support the claim that…” |
| Fail to Reject the Null | “There is not sufficient sample evidence to reject the claim that…” | “There is not sufficient sample evidence to support the claim that…” |
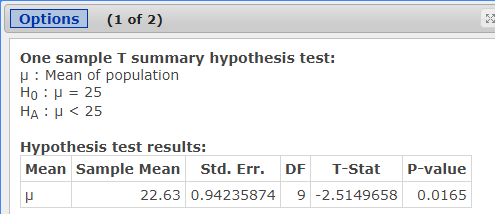
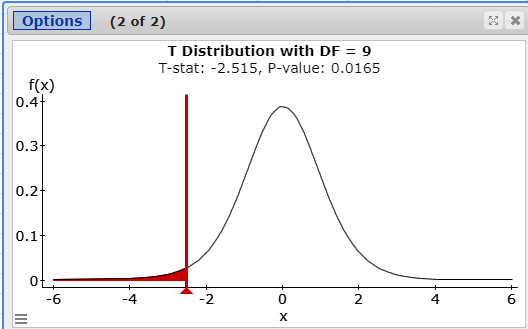
- Changing a Tire: The length of time to change a tire is normally distributed. A random sample of ten tire changes is taken with a mean of 22.63 minutes and a standard deviation of 2.98 minutes. Use a 0.05 significance level to test the claim that the mean time to change a tire is less than 25 minutes.
- Design the Study
- The original Claim:
\(\mu < 25\) - \(H_0\):
\(\mu \geq 25\) assume \(H_0\):\(\mu = 25\) - \(H_A\):
\(\mu < 25\) - Type of Test:
Left-tailed test - Level of Significance:
\(\alpha =.05\) - Degrees of Freedom:
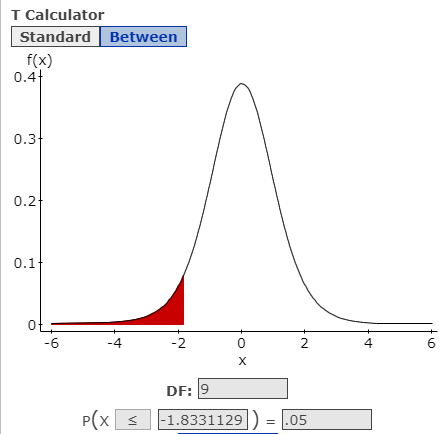
\(10-1=9\) - Critical Value(s):
\(t=-1.8331\) Determines shaded area(s)
- The original Claim:
- Results
- Test Statistic: A standardized value based on the sample data, assuming the null is true.
\(t=\frac{\overline{x}-\mu}{\left(\frac{s}{\sqrt{n}}\right)}=\frac{22.63-25}{\left(\frac{2.98}{\sqrt{10}}\right)}=-2.5150\)
- p-value:
0.0165 - Rejection Criteria: Reject \(H_0\) if
p value \(< \alpha\) and the test statistic (t) is in the rejection region. - Decision about the null:
Reject \(H_0\) Reason 1: 0.0165 < .05 or Reason 2: -2.5150 is in the rejection region
- Concluding statement about the claim:
There is sufficient evidence to support the claim the mean time to change a tire is less than 25 minutes.
- Test Statistic: A standardized value based on the sample data, assuming the null is true.
- Design the Study
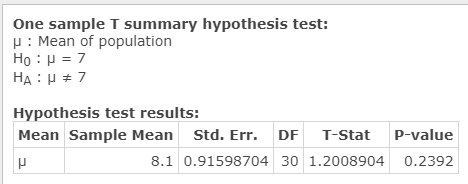
- Age of Cars: The mean age of cars driven by Pellissippi State students is seven years. The Dean of Students claims that this is an accurate statement for his students. A random sample of 31 cars in the East Parking Lot on campus showed a mean age of 8.1 years with a standard deviation of 5.1 years. Test the Dean’s claim at the 0.01 significance level.
- Design the Study
- The original Claim:
\(\mu = 7\) - \(H_0\):
\(\mu = 7\) assume \(H_0\):\(\mu = 7\) - \(H_A\):
\(\mu \neq 7\) - Type of Test:
Two-tailed test - Level of Significance:
\(\alpha =.01\) - Degrees of Freedom:
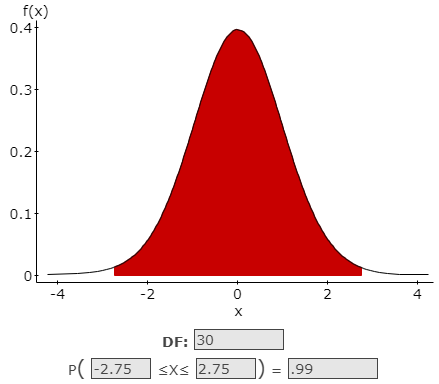
\(31-1=30\) - Critical Value(s):
\(t=\pm 2.750\) Determines shaded area(s)
- The original Claim:
- Results
- Test Statistic: A standardized value based on the sample data, assuming the null is true.
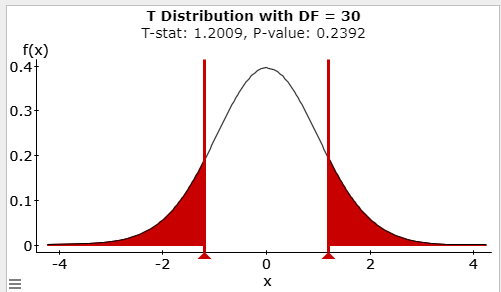
\(\mathrm{t}=\frac{\overline{x}-\mu}{\left(\frac{s}{\sqrt{n}}\right)}=\frac{8.1-7}{\left(\frac{5.1}{\sqrt{31}}\right)}=1.20089\)
- p-value:
0.2392 - Rejection Criteria: Reject \(H_0\) if
p value \(< \alpha\) and the test statistic (t) is in the rejection region.
- Decision about the null:
Fail to reject \(H_0\) Reason 1: 0.2392 > .01
Reason 2: 1.20089 is not in the rejection region - Concluding statement about the claim:
There is not sufficient evidence to reject the claim the mean age of cars driven by PSCC students is 7 years.
- Test Statistic: A standardized value based on the sample data, assuming the null is true.
- Design the Study
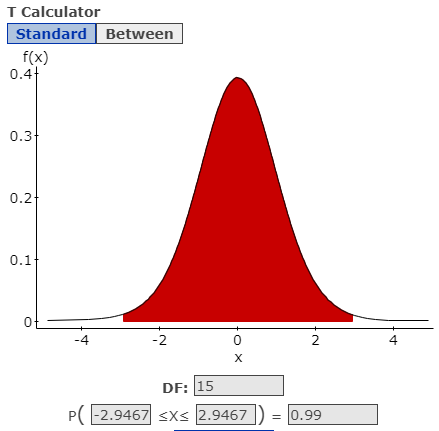
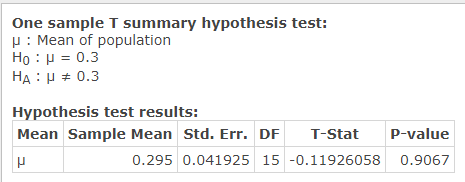
- Sugars in Cereal: In a sample of 16 cereals, the mean sugar content was measured at .295g and the standard deviation was .1677g. Use a .01 significance level to test the claim the true population mean sugar content (grams of sugar per gram of cereal) for all cereals is equal to 0.3g.
- Design the Study
- The original Claim:
\(\mu = 0.3\) - \(H_0\):
\(\mu = 0.3\) assume \(H_0\):\(\mu = 0.3\) - \(H_A\):
\(\mu \neq 0.3\) - Type of Test:
Two-tailed test - Level of Significance:
\(\alpha =0.01\) - Degrees of Freedom:
\(16-1=15\) - Critical Value(s):
\(t=\pm 2.947\) Determines shaded area(s)
- The original Claim:
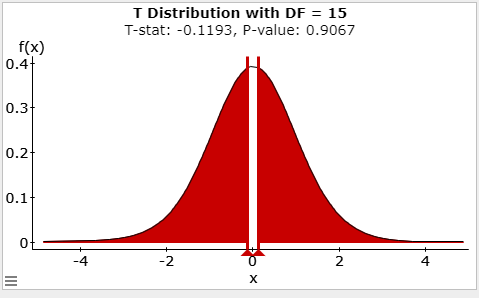
- Results
- Test Statistic: A standardized value based on the sample data, assuming the null is true.
\(t= \frac{\overline{x}-\mu}{\left(\frac{s}{\sqrt{n}}\right)} = \frac{.295-.3}{\left(\frac{.1677}{\sqrt{16}}\right)} =-0.1193\)
- p-value:
0.9067 - Rejection Criteria: Reject \(H_0\) if
p value \(< \alpha\) and the test statistic (t) is in the rejection region. - Decision about the null:
Fail to reject \(H_0\) Reason 1: 0.9067 > .01
Reason 2: -0.1193 is not in the rejection region
- Concluding statement about the claim:
There is not sufficient evidence to reject the claim the true mean sugar content for all cereals is equal to 0.3g.
- Test Statistic: A standardized value based on the sample data, assuming the null is true.
- Design the Study
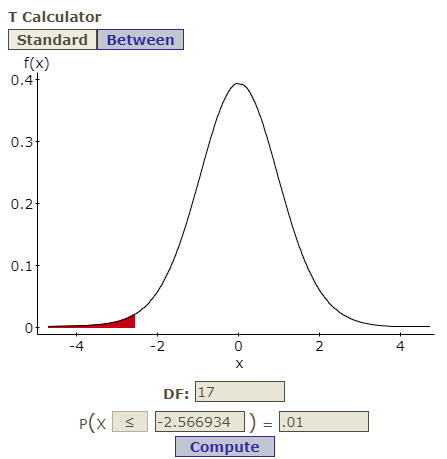
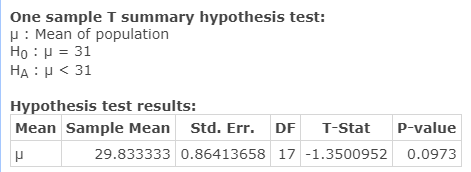
- Class Size: You receive a brochure from a large university. The brochure indicates that the mean class size for full-time faculty is fewer than 31 students. You want to test this claim. You randomly select 18 classes taught by full-time faculty and determine the class size of each. The results are shown in the table below. At a 0.01 significance level, can you support the university’s claim?
34 26 28 33 32 37 28 25 29 26 28 37 30 31 25 29 31 28 Sample Statistics: \(\overline{x}=29.8333333 \quad s=3.666221 \quad n=18\)
- Design the Study
- The original Claim:
\(\mu < 31\) - \(H_0\):
\(\mu \geq 31\) assume \(H_0\):\(\mu = 31\) - \(H_A\):
\(\mu < 31\) - Type of Test:
Left-tailed test - Level of Significance:
\(\alpha =0.01\) - Degrees of Freedom:
\(18-1=17\) - Critical Value(s):
\(t=-2.5669\) Determines shaded area(s)
- The original Claim:
- Results
- Test Statistic: A standardized value based on the sample data, assuming the null is true.
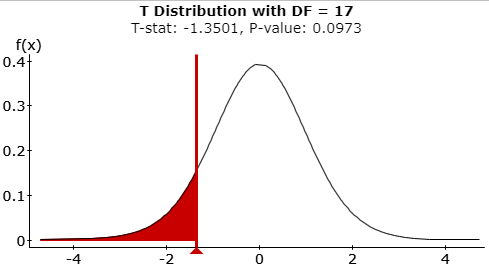
\(t =\frac{\overline{x}-\mu}{\left(\frac{s}{\sqrt{n}}\right)} = \frac{29.833333-31}{\left(\frac{3.66621}{\sqrt{18}}\right)}=-1.3501\)
- p-value:
0.0973 - Rejection Criteria: Reject \(H_0\) if
p value \(< \alpha\) and the test statistic (t) is in the rejection region. - Decision about the null:
Fail to reject \(H_0\) Reason 1: 0.0973 > .01
Reason 2: -1.3051 is not in the rejection region
- Concluding statement about the claim:
There is not sufficient evidence to support the claim the mean class size for full time faculty is fewer than 31 students.
- Test Statistic: A standardized value based on the sample data, assuming the null is true.
- Design the Study
Concluding Activity
Goldfish Smile Hypothesis Testing
Claim: The proportion of all goldfish with smiles is "less than, equal to, or greater than" 50% (choose one)
Your claim: _________________________
One possible choice is to claim that p > .50. The solutions on the rest of the activity will be based on this claim. However, this is not what you are required to choose when you complete this in class.
Sample Data
Number of goldfish: n = _______________
Number of SMILING goldfish: x = _______________
\( \hat{p} \) = _______________
H0: _______________
Ha: _______________
\( \alpha = .05\)
Test Statistic
z = General Formula = Specific Formula = Numeric Value
\( z = \frac{ \hat{p} - p}{\sqrt{\frac{pq}{n}}} = \frac{.35-.5}{ \sqrt{ \frac{(.5)(.5)}{100}}} = -3 \)
p-value: _______________
Rejection Criteria: Reject H0 if _____________________________________________
Decision: __________________________________________________
Concluding Statement:
_______________________________________________________________________________________________________________________________________________________________________________________________________________________________________________________________________________________________________________________________________
______________________________________________________________________________________________________________________________________________________________________________________________________________________________________________________________________________________________________________________________________-
______________________________________________________________________________________________________________________________________________________________________________________________________________________________________________________________________________________________________________________________________
There is not sufficient evidence to support the claim that the proportion of all goldfish with smiles is greater than 50%.
Use the sample to construct a 95% confidence interval for the proportion of smiling goldfish.
Best point esitmate: _______________
Find the margin of error E that corresponds to a 95% confidence level.
E = _______________
Find the 95% confidence interval estimate of the population proportion p.
How does your confidence interval indicate the decision you should make about whether or not you should reject H0?
.50 is within the confidence interval, so fail to reject H0.
Comparing Hypothesis Testing for the Mean and Hypothesis Testing for a Proportion
| Mean T-test | Proportion Z-test | |
|---|---|---|
| Question | It is claimed that the average time it takes to eat an apple is less than 4 minutes. A random sample of 25 apple eaters takes an average of 3.8 minutes to eat an apple with a standard deviation of 2.1 minutes. Test the claim using a 0.05 significance level. | It is claimed that more than 15% of sneakers that are sold attach with Velcro. A sample of 135 sneakers finds that 26 of them attache with Velcro. Thest the claim using a 0.10 significance level. |
| Hypothesis | Claim:
H0:
HA:
|
Claim:
H0:
HA:
|
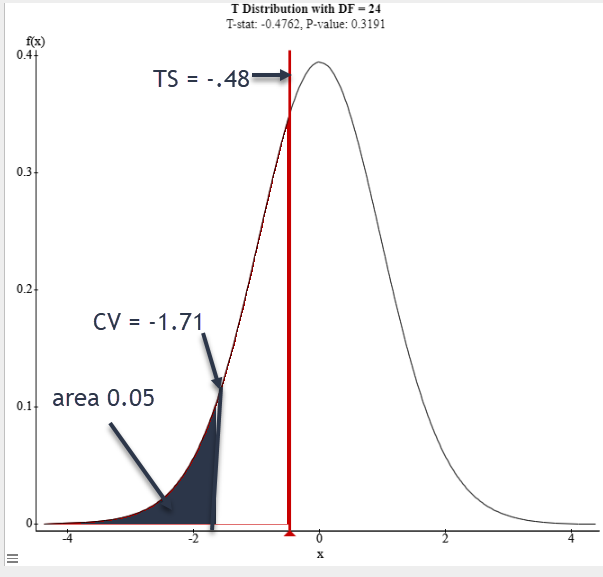
| Critical Value(s) | -1.71 |
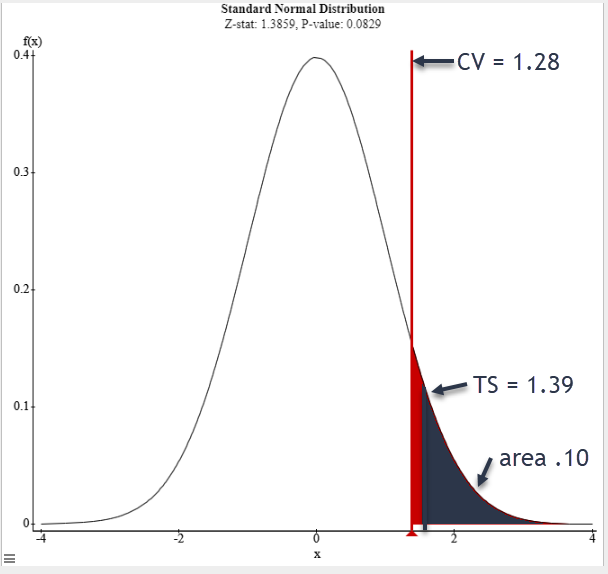
1.28 |
| Test Statistic | \( t = \frac{\bar{x} - \mu}{ \frac{s}{ \sqrt{n}}} = \)
|
\( z = \frac{ \hat{p} - p}{ \sqrt{ \frac{pq}{n}}} = \)
|
| Sketch the graph, label TS, CV, shade rejection region |
|
|
| P-Value |
|
|
| Decision (circle one) | Reject H0
Fail to Reject H0 Fail to reject H0 |
Reject H0
Fail to Reject H0 Reject H0 |
| Conclusion | There is not sufficient evidence to support the claim that the mean time to eat an apple is less than 4 minutes. |
There is sufficient evidence to support the claim that more than 15% of sneakers attach with Velcro. |