Unit 1 Describing Data
2.1 Frequency Distributions and Their Graphs
Characteristics of data: CVDOT which stands for Center, Variation, Distribution, Outliers, Time
Frequency Distributions
- Classes or Bins are intervals of equal width used to sort data.
- Lower Class Limits are the smallest numbers that can actually belong to a class.
- Upper Class Limits are the largest numbers that can actually belong to a class.
- Class Boundaries are the numbers used to separate classes (will usually be decimal).
- Class Midpoints are the values in the middle of a class.
- Class Width is the difference between two consecutive Lower Class Limits.
- Below is a summary of the data collected from students in the Irish Wristwatch Lab. Answer the following questions about the frequency table used to summarize the data.
TIME (in seconds) FREQUENCY 5.0 – 5.9 5 6.0 – 6.9 8 7.0 – 7.9 10 8.0 – 8.9 7 9.0 – 9.9 3 - What is the lower class limit of the 1st class?
5.0 - What is the upper class limit of the 1st class?
5.9 - What is the lower class limit of the 3rd class?
7.0 - What is the class midpoint of the 3rd class?
\(\frac{L C L+U C L}{2}=\frac{7.0+7.9}{2}=7.45\) - What is the class midpoint of the 1st class?
5.45 - Calculate the class width: Show work.
\(\mathrm{LCL} \quad 8.0-7.0=1.0\)
Relative and Cumulative Frequency Distributions
Relative Frequency Distributions (Percentages)
Instructions for finding a relative frequency distribution
- Add all the frequencies to get the sum of all frequencies.
- Divide each class frequency by the sum of all frequencies.
- What is the lower class limit of the 1st class?
- The following frequency distribution shows the ages of students in an evening section of Statistics at Pellissippi. Use the frequency distribution to construct a relative frequency distribution.
Age of PSCC Stat Students Frequency Relative Frequency Relative Frequency
(in percents)16-25 3 \(\frac{3}{32}=0.094\)
9.4%
26-35 7 \(\frac{7}{32}=0.219\)
21.9%
36 - 45 12 \(\frac{12}{32}=0.375\)
37.5%
46 - 55 8 \(\frac{8}{32}=0.25\)
25%
56 - 65 2 \(\frac{2}{32}=0.063\)
6.3%
\(\sum f=32\)
1.001
100.1%
- What is the upper class limit of the 3rd class?
45 - What is the lower class limit of the 5th class?
56 - What is the class width?
10 - Use the given frequency distribution to construct a cumulative frequency distribution.
- Each class is defined as: less than the lower class limit of the next class
- Add all frequencies of the current class and all previous classes. This is the cumulative frequency.
Age Range Frequency Cumulative Age Ranges Cumulative Frequency 16 - 25 3 Less than 26 3
26 - 35 7 Less than 36
10
36 - 45 12 Less than 46
22
46 - 55 8 Less than 56
30
56 - 65 2 Less than 66
32
Graphs of Frequency Distributions
Histograms using Boundaries
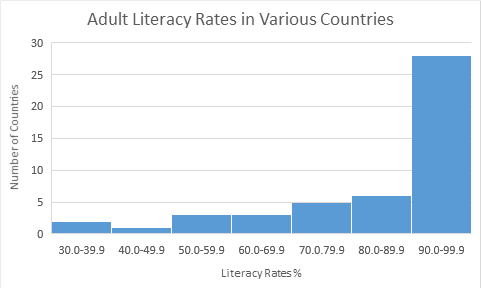
- Literacy Rates: Load the Literacy Rates data set in StatCrunch. The data represent the adult literacy rates for various countries. Adult literacy rate is the percentage of people ages 15 and above who can, with understanding, read and write a short, simple statement in their everyday life. Source: http://data.uis.unesco.org/
Link to accessible version of the Literacy Rate Table Accessible Literacy Rate Table
Create a Frequency Distribution and Histogram for the data. Determine the class width if you want to create a table with 7 classes.
The minimum value from the data is:
33.4 The maximum value from the data is:
99.8 Calculate the class width using the minimum data value, maximum data value, and number of classes:
\(\frac{99.8-33.4}{7}=\frac{66.4}{7}=9.49\)
When calculating class width, always round up to the next value. Because we calculated 9.49, we will use a class width of 10. For our frequency distribution, we will have a more usable frequency distribution if we set 30 as our lower class limit instead of 33.4. This will also prevent us from having a Literacy Rate higher than 100% for our upper limit in our highest class. In your online homework, use the actual minimum value for the lower limit of the first class in your frequency table.
Literacy Rate Frequency 30.0 – 39.9 2
40.0 – 49.9
1
50.0 – 59.9
3
60.0 – 69.9
3
70.0 – 79.9
5
80.0 – 89.9
6
90.0 – 99.9
28
- Answer the following review questions about the frequency table in the problem above.
- What is the lower class limit of the 5th class?
70.0 - What is the class midpoint of the 4th class?
64.95 - What is the class midpoint of the 1st class?
34.95 - Calculate the class width: Show work.
Using LCL \(40.0-30.0=10\); Using UCL \(49.9-39.9=10\)
Histograms using Midpoints
- What is the lower class limit of the 5th class?
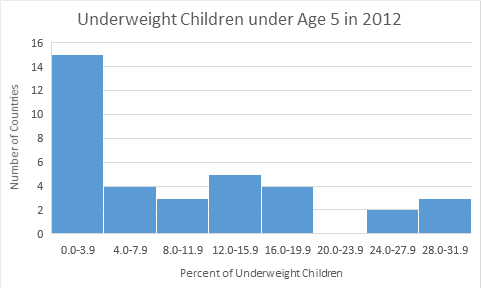
- Malnutrition – Percent of underweight children: Load the Malnutrition data set in StatCrunch. The data represent the percentage of children under age 5 who were underweight in 2012, based on World Health Organization standards.
Source: World Bank Malnutrition Data
Link to accessible version of the Malnutrition Table Accessible Malnutrition Table
Create a Frequency Distribution and Histogram for the data. Begin with a lower class limit of 0.0 and use a class width of 4.0.
Midpoint % underweight children Frequency 1.95
0.0- 3.9 15
5.95
4.0-7.9
4
9.95
8.0-11.9
3
13.95
12.0-15.9
5
17.95
16.0-19.9
4
21.95
20.0-23.9
0
25.95
24.0-27.9
2
29.95
28.0-31.9
3
- Answer the following review questions about the frequency table above.
- What is the lower class limit of the 4th class?
12 - What is the class midpoint of the 4th class?
13.95 - Calculate the class width: Show work.
\(4.0-0.0=4\)
- What is the lower class limit of the 4th class?