Unit 1 Describing Data
2.3 Measures of Central Tendency
Mean, Median, Mode, Midrange
Notation:
\(\sum\) denotes the sum of a set of values
\(x\) is the variable usually used to represent the individual data values
\(n\) lower case n represents the number of data values in a sample
\(N\) upper case N represents the number of data values in a population
Arithmetic Mean:
Mean of a Sample (this is a statistic) \(\overline{x}=\frac{\sum x}{n}\)
Mean of a Population (this is a parameter) \(\mu=\frac{\sum x}{N}\)
Median:
- The median is the middle value.
- Position of the Median \(P_{50}=\frac{n+1}{2}\)
- Advantage The median is not affected by an extreme value.
Mode:
- Mode the value that occurs most often
- Bimodal data containing 2 modes
- Multimodal data containing 3+ modes
- No Mode no value that occurs most often
- Advantage can be used with nominal data
MidRange:
- The mean of the max and min values in the original data set
- Midrange=\(\frac{\left(x_{\min }+x_{\max }\right)}{2}\)
- Advantage The midrange is very easy to compute.
- Disadvantage The midrange is sensitive to extremes so it is rarely used.
Round off Rule for Measures of Center:
Carry one more decimal place than is present in the original set of values.
- Calculate the measures of central tendency for the life expectancies from the given data. Verify using technology.
Country Health $ per capita Obesity % Life expectancy Universal Healthcare Canada 5292 30.1 82 yes China 420 7.3 76 no Germany 5411 22.7 81 yes Italy 3258 23.7 84 yes Japan 3703 3.5 84 yes Mexico 677 27.6 77 no Norway 9522 24.8 82 yes Switzerland 9674 21 83 yes United Kingdom 3377 29.8 82 yes United States 9403 35 79 no
- Mean:
81 - Median:
82 - Position of the Median:
\(\frac{n+1}{2}=\frac{10+1}{2}=5.5\) - Mode:
82 - Midrange:
\(\frac{76+84}{2}=80\)
- Mean:
- Using the table in the problem above, calculate the measures of central tendency for the obesity percentages from the given data. Verify using technology.
- Mean:
22.55 - Median:
24.25 - Position of the Median:
\(\frac{n+1}{2}=\frac{10+1}{2}=5.5\) - Mode:
none - Midrange:
\(\frac{3.5+35}{2}=19.25\)
- Mean:
- What do you notice about the measures for the 2 sets of data?
- Shanita made a note of the weights of 8 baskets of fruit, but she spilled coffee on the fruit and the last number got smudged. If the average weight of the baskets is 12.5 pounds, how much was the smudged number? In other words, how much did the 8th basket of fruit weigh?
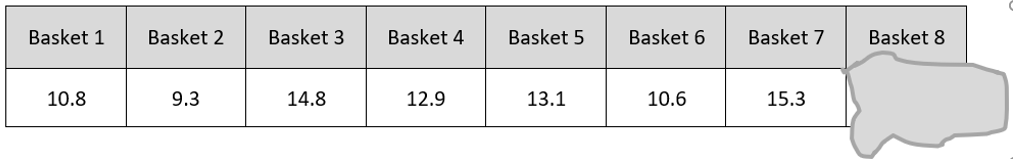
Sum of basket weights is \(8*12.5 = 100\), so basket 8 must be \(100 – 86.8 = 13.2\)
- The mean weight of three dogs is 60 pounds. Which of the following is possible? (Answer yes or no.)
- One of the dogs weighs 100 pounds.
yes - None of the dogs weighs more than 60 pounds.
yes - Each dog weighs less than 60 pounds.
no - The dogs weigh 25, 55, and 110 pounds.
no - The dogs weigh 24, 52, and 104 pounds.
yes - Altogether the dogs weigh 180 pounds.
yes
- One of the dogs weighs 100 pounds.
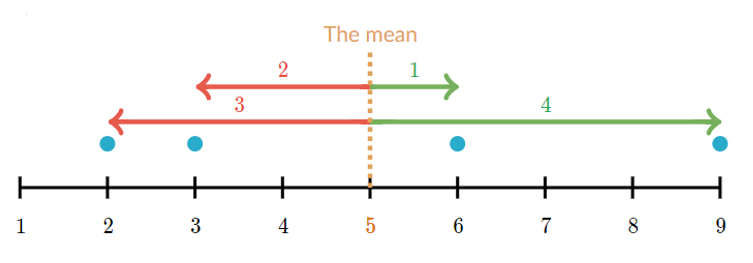
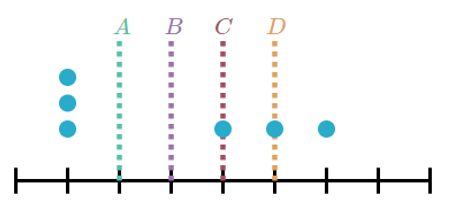
- The mean can alternately be defined as the balancing point. Total distance below the mean = total distance above the mean. The mean of 2, 3, 6, and 9 is 5. Note that 3 + 2 = 1 + 4.
- Which of the lines represents the mean of the data points shown below.
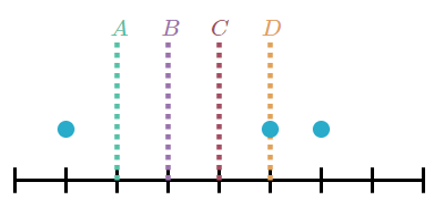
C
- Which of the lines represents the mean of the data points shown below.
B
- Which of the lines represents the mean of the data points shown below.
-
Calculate the semester grade point average (GPA) for the student with the following grades:
Course Credit Hours Grade Point Value for Grade Quality Points (Points x hours) ENGL 1020 3 C 2
6
MATH 1530 3 A 4
12
COMM 1010 3 B 3
9
BIOL 1110 4 C 2
8
COLL 1000 1 B+ 3.5
3.5
Total 14
38.5
\(\frac{38.5}{14}=2.75\)
Calculating by Formula:
\(\overline{x}=\frac{\sum(f \cdot x)}{\sum f} \quad\quad \text{Use class midpoints for x}\)
- Find the estimated mean of the following data:
SECONDS FREQUENCY MIDPOINTS 5.0 – 5.9 5 5.45
6.0 – 6.9 8 6.45
7.0 – 7.9 10 7.45
8.0 – 8.9 7 8.45
9.0 – 9.9 3 9.45
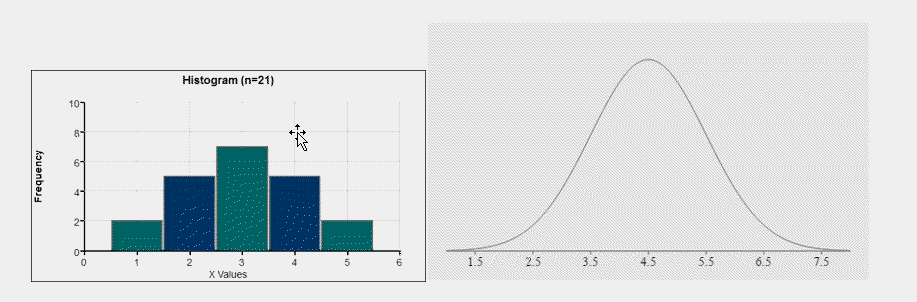
- What is the estimated mean of the data?
7.30 By Formula: \(\overline{x}=\frac{\sum(f \cdot x)}{\sum f}=\frac{5(5.45)+8(6.45)+10(7.45)+7(8.45)+3(9.45)}{33}=\frac{240.85}{33} \approx 7.30\)
- What is the upper limit of the 4th class?
8.9 - What is the class width?
1.0 - What is the shape of the distribution?
Normal - What class holds the median number of seconds?
7.0-7.9
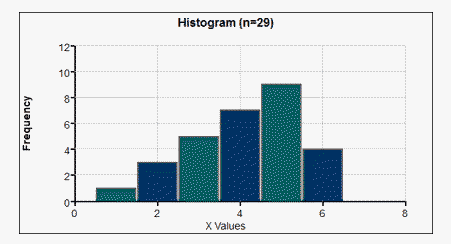
- Below is a frequency distribution of the ages of riders for one ride on the Dahlonega Mine Train at Six Flags. Find the estimated mean of the following data:
Age of Riders, in years Number of Riders 10 - 14 1 15 - 19 2 20 - 24 7 25 - 29 15 30 - 34 4
- What is the estimated mean of the data?
25.3 - What is the upper limit of the 1st class?
14 - What is the class width?
5 - Using LCL
\(15-10=5\) - Using UCL
\(29-24=5\) - Using midpt
\(32-27=5\)
- Using LCL
- What is the shape of the distribution?
Left tail - What class holds the median number of seconds?
Class 25-29 Position of the median: \(\frac{n+1}{2}=\frac{29+1}{2}=\frac{30}{2}=15\). Add frequencies until you reach 15.
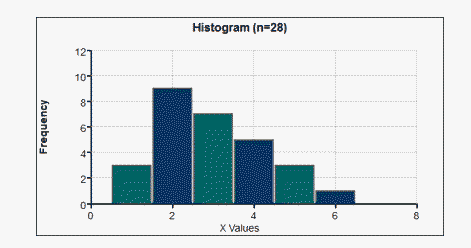
- Find the estimated mean of the following data:
Shapes of Distributions
Symmetric (Normal):
Mean and Median are the same as Mode
Skewed To The Left (negatively skewed):
Mean and Median are to the LEFT of the Mode (Left Tail)
Skewed To The Right (positively skewed):
Mean and Median are to the RIGHT of the Mode (Right Tail)
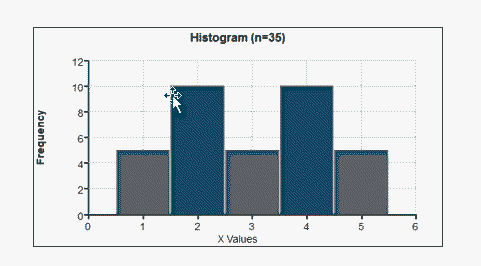
Bimodal:
Two Modes
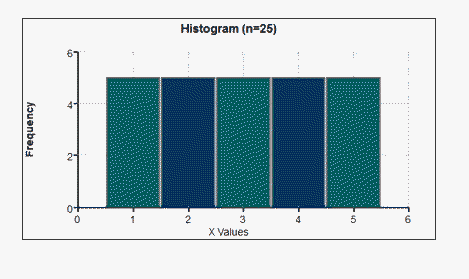
Uniform:
All frequencies are the same