Unit 1 Describing Data
1.3 Data Collection and Experimental Design
Sampling Techniques
Watch this: Sampling Video
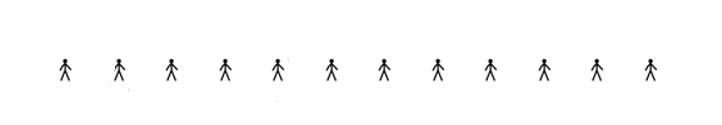
Random Sampling:
Members from the population are selected in such a way that each individual member in the population has an equal chance of being selected.
Example: Put all the names in a hat and select names by drawing them from the hat.
Convenience Sampling:
Use results that are easy to get.
Example: Stand at the entrance to store and survey people who walk by.
Voluntary Response Sampling:
Ask the question and respondents themselves decide whether to be included.
Example: Mail-in survey, American Idol, internet survey
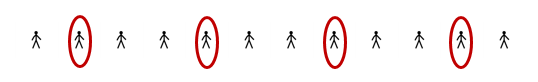
Systematic Sampling:
Select some starting point.
Then select every kth element in the population.
Example 1: In a contact list, start with the 2nd person and then select every 5th person for your sample.
Example 2: Start with the second person and select every third person.
Stratified Sampling:
Subdivide the population into at least 2 different subgroups that share the same characteristics.
Select a random sample from each subgroup (or stratum).
Example: Randomly select one person from each Statistics class at PSCC to survey.
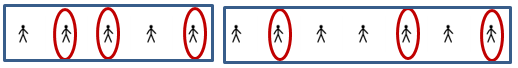
Cluster Sampling:
Divide the population area into sections (or clusters
Randomly select some of those clusters. Choose ALL members of the selected clusters.
Example: Randomly select one Statistics class at PSCC, and surveying everyone in that class.

- Every fifth person boarding a plane is searched thoroughly.
systematic - Five math classes are randomly selected out of 20 and all of the students from each class are interviewed.
cluster - A researcher randomly interviews ten Math professors and ten History professors.
stratified - A researcher for an airline interviews all of the passengers on five randomly selected flights.
cluster - A radio station broadcast in the city of Knoxville asked people to call in and express their opinion of the city mayor.
voluntary response - A PSCC student interviews everyone in a biology class to determine the percentage of students that own a car.
convenience - A market researcher randomly selects 200 drivers under 35 years of age and 100 drivers over 35 years of age.
stratified - All of the teachers from 85 randomly selected nation’s middle schools were interviewed.
cluster - To avoid working late, the quality control manager inspects the last 10 items produced that day.
convenience - The names of 70 contestants are written on 70 cards. The cards are placed in a bag, and three names are picked from the bag.
random
Types of Studies
Observational Study
Observing and measuring specific characteristics WITHOUT attempting to modify the subjects in the study.
Experimental Study
Apply some treatment and then observe its effects on the subjects.
Observational versus Experimental
- A study of the salaries of college professors in a particular state
observational - A study of the effects of a fertilizer on a soybean crop
experimental - A study of the proportion of students who spend more than $300 per semester on books
observational - A study of the change in cognitive functioning after consuming two beers.
experimental - A study of the effects of long term smoking on life expectancy.
observational
Forming Conclusions and Identifying Bias
In statistics, the main question we ask is: Are my results statistically significant?
Practical Significance:
Practical significance is the common use of the word significant.
The results have practical significance if they are deemed “worth the effort” by common sense analysis.
Statistical Significance:
In statistics, we use the term significant to refer to statistical significance.
Statistical significance is based on the probability an event will occur if the assumptions we have made about the population are actually true.
The results have statistical significance if they are unlikely to occur by chance.
There is a difference between practical and statistical significance:
“While statistical significance relates to whether an effect exists, practical significance refers to the magnitude of the effect. However, no statistical test can tell you whether the effect is large enough to be important in your field of study. Instead, you need to apply your subject area knowledge and expertise to determine whether the effect is big enough to be meaningful in the real world. In other words, is it large enough to care about?
How do you do this? I find that it is helpful to identify the smallest effect size that still has some practical significance. Again, this process requires that you use your knowledge of the subject to make this determination. If your study’s effect size is greater than this smallest meaningful effect, your results are practically significant.
For example, suppose you are evaluating a training program by comparing the test scores of program participants to those who study on their own. Further, we decide that the difference between these two groups must be at least five points to represent a practically meaningful effect size. An effect of 4 points or less is too small to care about.
After performing the study, the analysis finds a statistically significant difference between the two groups. Participants in the study program score an average of 3 points higher on a 100-point test. While these results are statistically significant, the 3-point difference is less than our 5-point threshold. Consequently, our study provides evidence that this effect exists, but it is too small to be meaningful in the real world. The time and money that participants spend on the training program are not worth an average improvement of only 3 points.
Not all statistically significant differences are interesting!”
Sources of Flaws in Statistical Analysis
Flaws can arise at any point in the study. Here are some types of errors and flaws in a study:
Bad samples
collecting sample data that is not representative of the population being studied- Using any non-random method of sampling.
- Small samples – likely to underrepresent small subgroups within the population being sampled.
- Missing data – characteristics of a subgroup that make it harder to sample than most of the population, such as homelessness during the national census, may cause the subgroup to be underrepresented.
- Bias introduced by data collection instruments – “loaded” survey questions, item order in a sequence, self-reporting desired characteristics rather than measured actual characteristics (such as body weight).
Bad analysis
errors in performing or interpreting analysis of the data collected- Correlation does not imply causation – two data variables that may appear to be linked may both depend on a third “hidden” variable, rather than on each other. Example: During the summer, both consumption of ice cream and energy cost of air conditioning will rise, but neither rise causes the other; both increases are due to increased average high daily temperature, the hidden cause.
- Some studies are sponsored by people or companies who may benefit from a possible result; such studies may be aimed or slanted to produce the desired result.
Bad presentation
misleading presentation of analysis and conclusions- Visual forms like graphs and charts can be presented in misleading ways.
- Percentages can be misleading or unclear. 100% of a quantity is all of it; you cannot reduce a quantity by more than 100%, and reducing it by 100% means it becomes zero.
- Precise numbers may not be accurate numbers.
- Study results may be presented to mislead others about conclusions reached.
- Explain what bias there is in a study done entirely online.
It is limited to people with computers. - A local newspaper ran a survey by asking, “Do you support the development of a weapon that could kill millions of innocent people?” Determine whether the survey questions is biased and why.
The survey is biased because the question leads people to believe the weapon will be used to kill innocent people.
Identifying Bias
Math Review
- What is 35% of 542?
\((0.35) 542=189.7\)
- If 40 people of a group of 542 said “yes”, what percent said “yes”?
\(\frac{40}{542}=0.0738=0.074=7.4 \%\)
Activity
- Respond to the following potential survey questions. If the question can be improved, rewrite the survey question in a better way
- Which of these bests represents your opinion on gun control?
- The government should confiscate our guns.
- We have the right to keep and bear arms.
- In view of escalating environmental degradation and predictions of serious resource depletion, would you favor economic incentives for recycling of resource-intensive consumer goods?
- Which of these bests represents your opinion on gun control?
- Explain why the following sample might be biased. Select an alternative method for choosing a more representative sample.
The campus food service wants to know how students feel about their food. They hand out a survey during Friday morning breakfast between 7 a.m. and 9 a.m.