Statistics Unit
2.4 Fundamentals of Statistics
POPULATION: the complete set of people or things being studied
SAMPLE: the subset of the population from which the raw data were actually obtained
SAMPLE STATISTICS: a value calculated using the data from a sample
POPULATION PARAMETER: a value calculated using all the data from a population
SAMPLING METHODS:
- Simple Random Sampling
- Systematic Sampling
- Convenience Sampling
- Stratified Sampling
- Quota sampling
- Cluster Sampling
- Voluntary Response Sampling
Example: The names of 25 employees are chosen out of a hat from a company of 250 employees.
Example: You select every tenth person for an experiment from a list of 10,000 names.
Example: A researcher working at a university chooses students from the university to participate in a study.
A researcher divides the population into subgroups and then randomly selects participants from each subgroup.
Sampling continues until preset quotas are reached. Example: A researcher wants 40 women and 60 men for a total of 100 respondents to match population characteristics.
The population is divided into clusters and then a sample is chosen by randomly selecting an entire cluster.
Samples are formed using self-selected volunteers like when a radio show asks for listeners to call in to complete a survey.
SAMPLING BIAS: A sampling method is biased if every member of the population does not have equal likelihood of being in the sample.
TYPE OF STUDY:
- Observational: observe or measure characteristics
- Experiment: apply treatment to some or all and observe the effects
- Treatment group
- Control group
- Placebo effect
- Single blind
- Double blind
CONFIDENCE INTERVAL: found by adding AND subtracting the margin of error from the sample statistic
BASIC STEPS IN A STATISTICAL STUDY
- Determine the research question for your study.
- Choose a representative sample.
- Collect the raw data and summarize these data.
- Use the sample statistics to infer information about the population.
- Draw conclusions.
Statistical Studies
70 Percent of College Students Stressed About Finances
“Seven out of 10 college students feel stressed about their personal finances, according to a new national survey.”
“The findings come from the National Student Financial Wellness Study, which surveyed 18,795 undergraduate students at 52 colleges and universities across the country. It included students from four-year and two-year private and public institutions.”
Source: Website Source for Study
Assume students were proportionally selected from 26 two-year institutions, 13 four-year public institutions and 13 four-year private institutions.
Population
All college students
Sample
18,795 undergraduate students
Sample Statistics
7 of 10 college students are stressed about personal finances.
Sampling Methods
Stratified
Type of Study
Observational
If the margin of error is +/-3%, find the confidence interval.
70% +/- 3% = 67% - 73%
Tests of Cholesterol Drugs Offer Hope of Reducing Heart Attacks and Strokes
“A new class of experimental cholesterol drugs might sharply reduce the risk of heart attacks and strokes, researchers reported on Sunday, citing what they described as preliminary evidence.”
“The study of Amgen’s evolocumab involved 4,465 patients with various degrees of risk, two-thirds of whom were randomly chosen to get the drug in addition to the medication they were already taking. After one year, 0.95 percent of those in the group that received the drug had suffered a heart attack, stroke or other cardiovascular problem, compared with 2.18 percent in the group that did not take the drug. By a measure known as the hazard ratio, the risk of cardiovascular events was reduced by 53 percent. The margin of error for the study was +/- 2.3%
Source: Website Source for Cholesterol Study
Assume the patients were volunteers who responded to an advertisement looking for cases in a drug study.
Population
All people with various degrees of risk for a cardiovascular problem.
Sample
4,465 at-risk patients
Sample Statistics
0.95% of experimental group suffered a cardiovascular problem, 2.18% of control group suffered a cardiovascular problem and there was a 53% reduced risk of a problem
Sampling Methods
Voluntary response
Type of Study
Experimental
Find the confidence interval for the reduced risk of experiencing a cardiovascular problem.
53% +/-2.3% = 50.7% - 55.3%
Harvard Youth Poll
March 28, 2023
For over twenty years, the Harvard Public Opinion Project has provided the most comprehensive look at the political opinions and voting trends held by Gen Z and Millennials.
A national poll of America’s 18-to-29-year-olds conducted between March 13 and March 23, 2023 by the Institute of Politics at Harvard Kennedy School indicates that more than three-in-five (63%) believe our gun laws should be stricter -- including a majority of young people in college and not in college; a majority of young white, Black, Hispanic and Asian-Americans; a majority of males and females; and a majority of those living in urban areas, suburbs, and small towns.
This poll of 2,069 18-to-29-year-olds was organized with undergraduate students from the Harvard Public Opinion Project (HPOP) and supervised by John Della Volpe, IOP Director of Polling. Data were collected by Ipsos Public Affairs using the KnowledgePanel Calibration approach. In this approach, the calibrating sample was provided by the KnowledgePanel probability-based sample source (n=1,033), while the sample to be calibrated was provided by non-probability, opt-in web panel sample sources (n=1,036). Interviews were conducted in English and Spanish between March 13 and March 23, 2023. The target population for this survey is US residents between the ages of 18 and 29. Data are weighted to reflect population estimates based on age-group, race, Hispanic ethnicity, educational attainment, household income, urbanicity, and geographic region of residence. The margin of error for the total sample is +/- 2.86%.
Source: Harvard Kennedy School Institute of Politics
Population
Sample
Sample Statistics
Sampling Methods
Type of Study
Confidence Interval
Calculating the Probability of an Event
\(P(E)=\frac{\# \text { of Possible Successes}}{\text {Total } \# \text { of Possible Outcomes}}=\frac{n(E)}{n(S)}\)
- \(0 \leq P(E) \leq 1\)
- The probability of an impossible event is zero.
- The probability of a sure event is one.
- In a bag, you have
- 4 blue chips numbered 1, 2, 3, & 4
- 3 red chips numbered 1, 2, & 3
- 2 green chips numbered 1 & 2
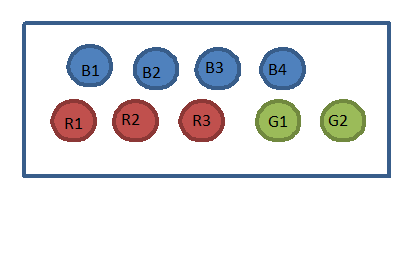
You randomly select one chip from the bag.
Write each probability in fraction, decimal (rounded to 4 decimal places), and percentage form (rounded to two decimal places).
- \(P(blue)=\)
\(\frac49, \;0.4444, \; 44.44\%\) - \(P(3)=\)
\(\frac29, \;0.2222, \; 22.22\%\) - \(P(\overline B)=P(not\;blue)=\)
\(\frac59, \;0.5556, \; 55.56\%\) - \(P(green\; or\; 4)=\)
\(\frac13, \;0.3333, \; 33.33\%\)
Pellissippi State Student Enrollment
- attended in 2023?
\(\frac{7445}{15,137}= 0.4918= 49.18\%\) - was a Non Degree Seeking Student?
\(\frac{4073}{15,137}= 0.2691=26.91\%\) - was a Sophomore?
\(\frac{5210}{15,137}= 0.3442=34.42\%\) - was a First Time Freshman in 2024?
\(\frac{405}{15,137}= 0.0268=2.68\%\) - was a Transient student in 2023?
\(\frac{94}{15,137}= 0.0062=0.62\%\)
| Year |
First Time Freshmen |
Non Degree Seeking |
Other Freshmen |
Sophomore |
Transient |
Total |
|---|---|---|---|---|---|---|
| 2023 |
524 |
1869 |
2347 |
2611 |
94 |
7445 |
| 2024 |
405 |
2204 |
2402 |
2599 |
82 |
7692 |
| Total |
929 |
4073 |
4749 |
5210 |
176 |
15,137 |
One person is randomly selected from the students enrolled at PSCC in 2023 or 2024. Using the data in the table, what is the probability that the person chosen: