Statistics Unit
2.10 The Normal Distribution
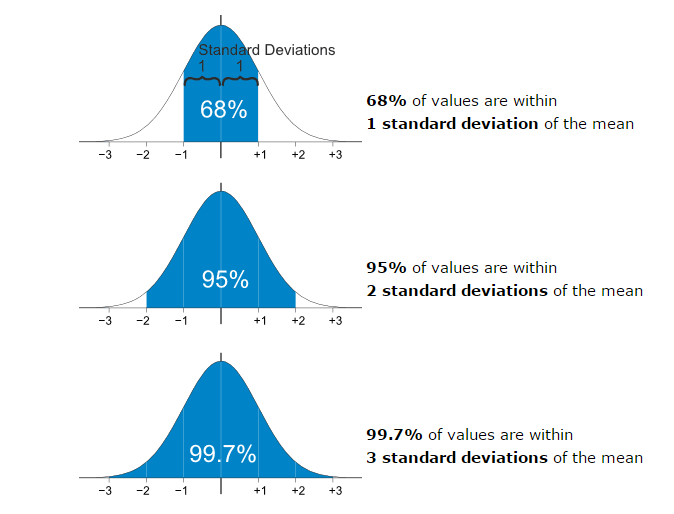
The normal distribution is the most commonly-used probability distribution in all of statistics.
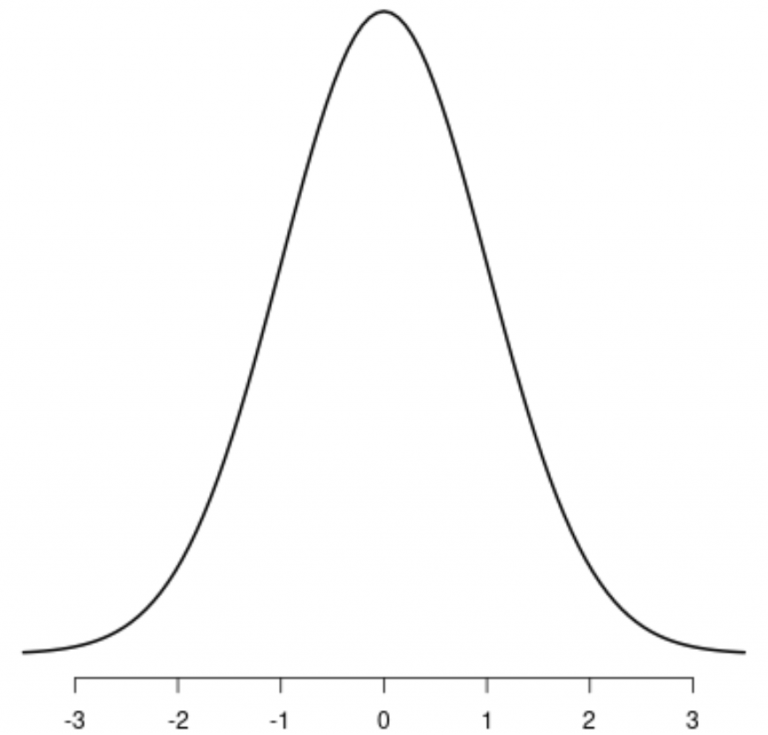
It has the following properties:
- Bell shaped: most data values clustered near the mean, well-defined single peak
- Symmetrical: data values spread evenly around the mean, larger deviations from the mean become increasingly rare, tapering tails of the distribution.
- Has one mode (peak)
- Mean and median are equal; both are located at the center of the distribution
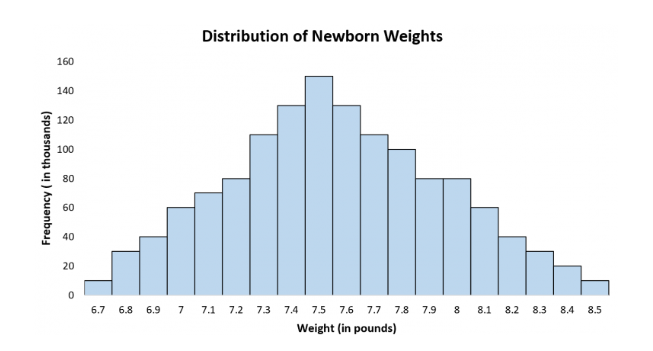
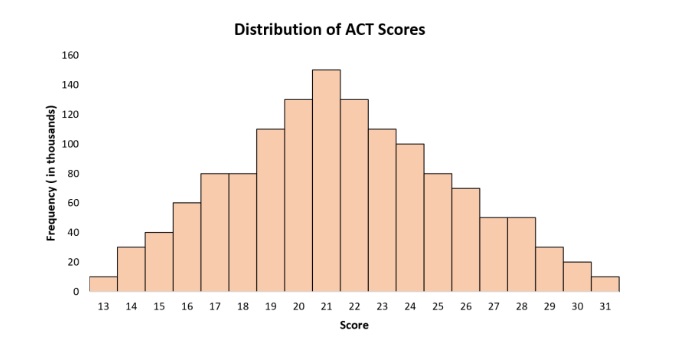
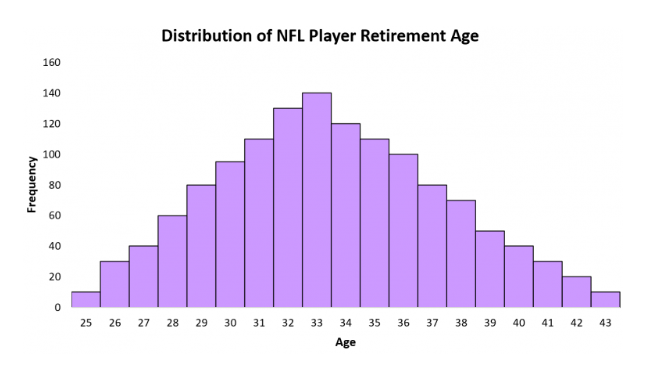
Examples of things that are normally distributed.
- Birthweight of Babies
- ACT Scores
- Average NFL Player Retirement Age
- The amount of Coca-Cola in a two-liter bottle is normally distributed with a mean of 2.05 liters and a standard deviation of 0.1 liters. (0.1 liters is approximately 3 ounces or 0.4 cups)
Sketch a distribution curve and label.
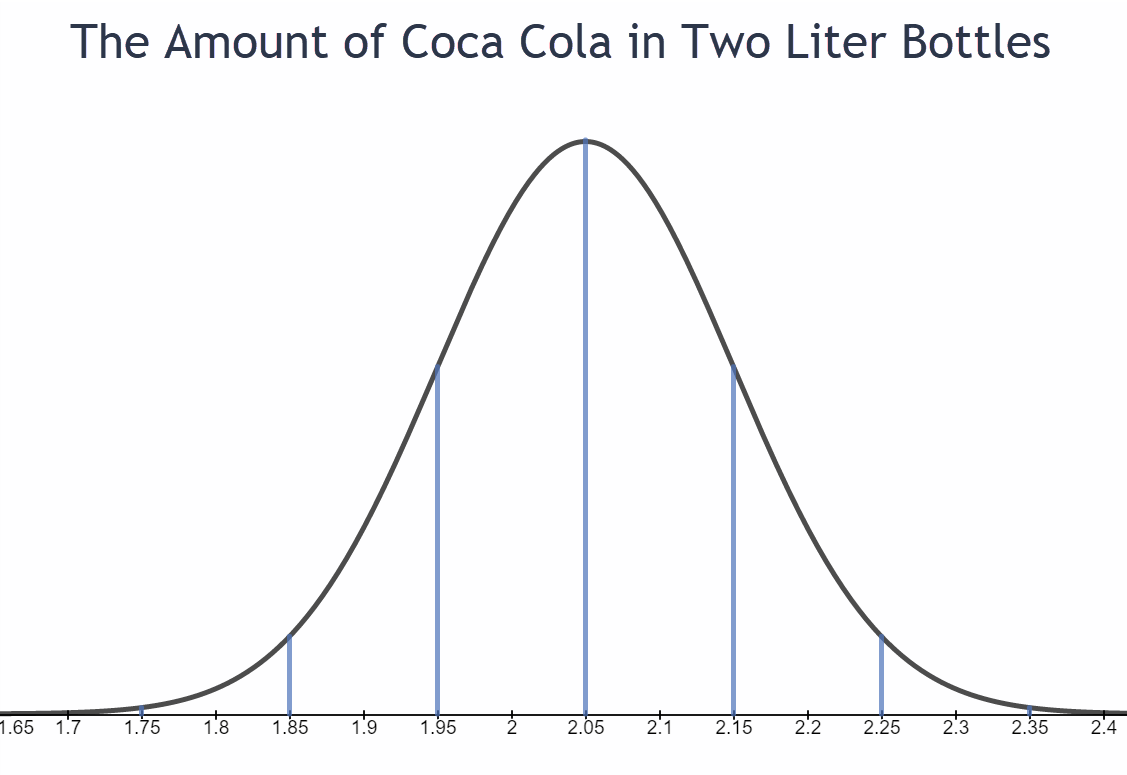
- What percentage of two-liter Coca-Cola bottles contain between 1.95 and 2.15 liters?
- What percentage of two-liter Coca-Cola bottles contain more than 2.05 liters?
- The range of liters that approximately 95% of all Coca-Cola bottles is from ___________ to ___________.
- What percentage of two-liter bottles contain between 1.85 and 2.15 liters?
- What percentage of two-liter bottles contain less than 1.85 liters?
- In a sample of 10,000 two-liter Coca-Cola bottles, how many would be expected to contain more than 2.35 liters? (This is almost 1.5 cups above the advertised 2 liters)
68%
50%
1.85 to 2.25 liters
81.5%
2.5%
\(.0015 \cdot 10000 = 15\) bottles
- The average gas mileage for a hybrid Honda Civic is normally distributed with a mean of 44 miles per gallon and a standard deviation of 5 mpg.
Sketch a distribution curve and label.
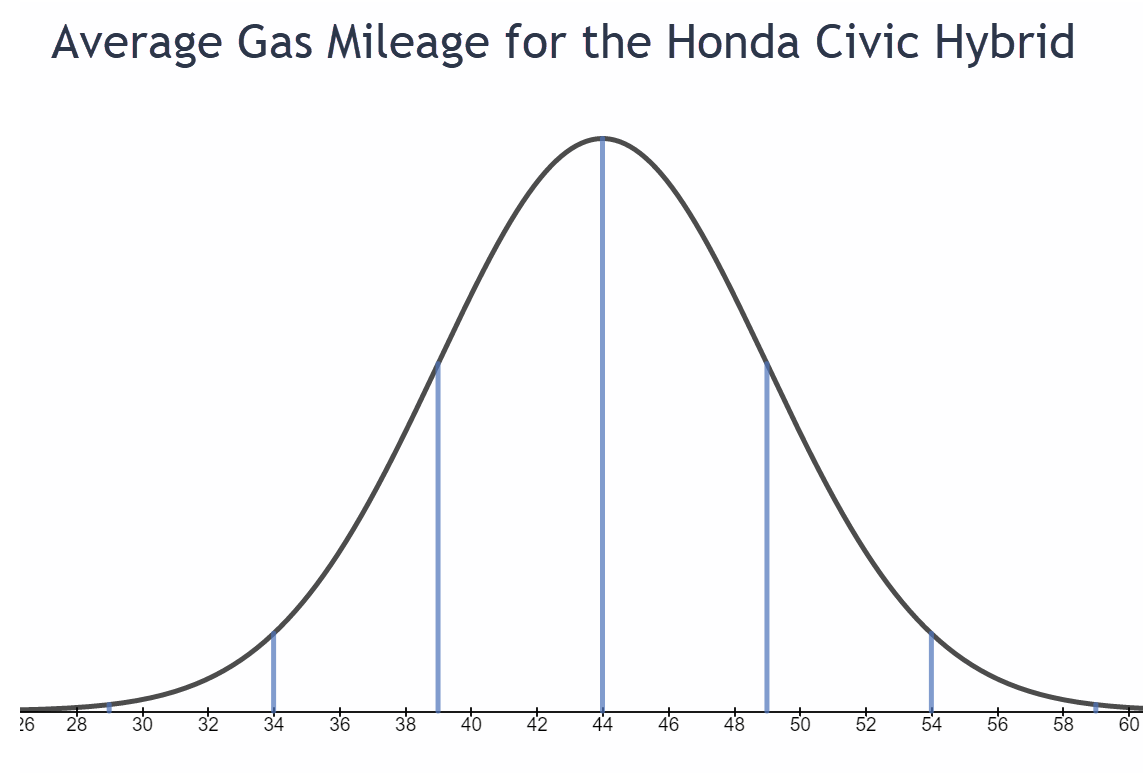
- What percentage of Honda Civic hybrids get better than an average of 49 miles per gallon?
- What percentage of Civic hybrids get worse than an average of 39 miles per gallon?
- What percentage of Civic hybrids get between 29 and 39 miles per gallon?
- The range in miles per gallon for 99.7% of Civic Hybrids is from ______________ to ______________.
- In a sample of 500 Civic hybrids, how many would be expected to get between 39 and 49 miles per gallon on average?
- In a sample of 500 Civic hybrids, how many would be expected to get better than an average of 59 miles per gallon?
16%
16%
15.85%
29 to 59 mpg
\(0.68 \cdot 500 = 340\) Honda Civic Hybrids
\(0.0015 \cdot 500 = 0.75\)
Less than one Honda Civic Hybrid per 500 Civics will get between 39 and 49 mpg.
- The average time a college student is on social media each week is normally distributed with a mean of 32 hours and a standard deviation of 5 hours.
Sketch a distribution curve and label.
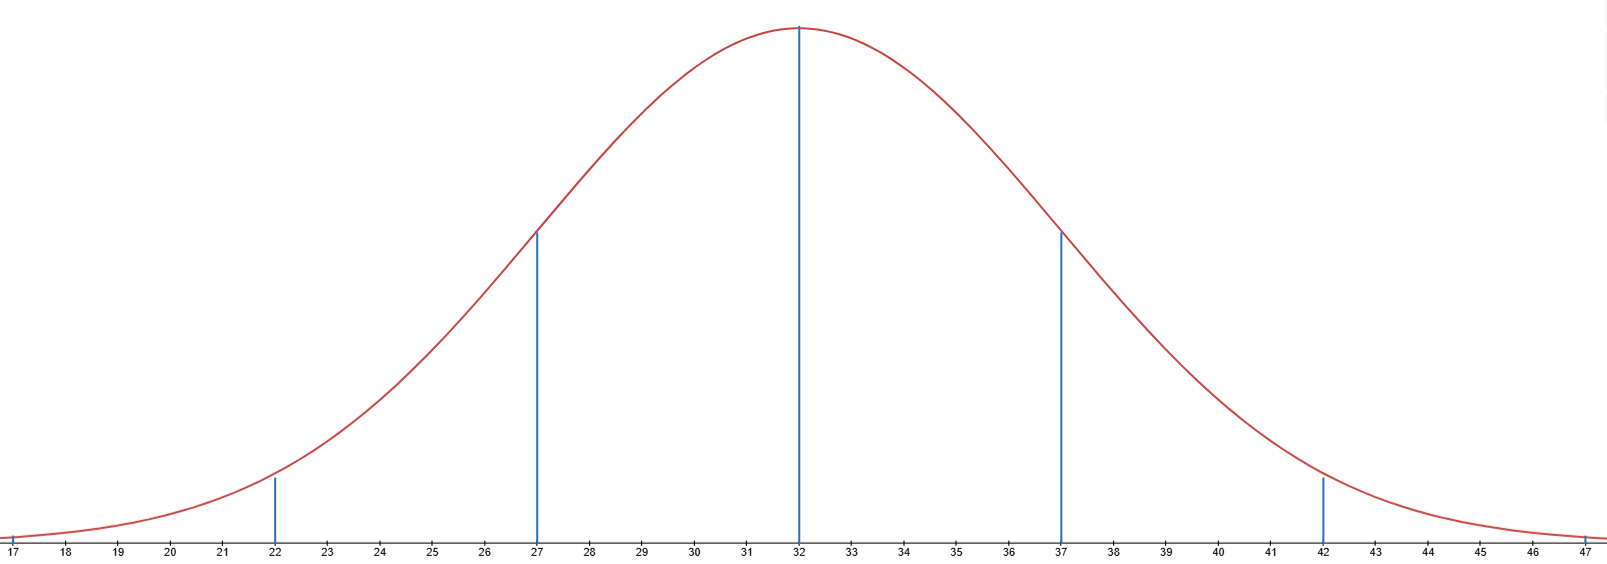
- What percentage of college students spend more than 37 hours on social media each week?
- What percentage of college students spend less than 32 hours a week on social media?
- What percentage of students spend between 27 and 42 hours a week on social media?
- The range in hours per week on social media for 99.7% of college students is from ______________ to ______________.
- In a sample of 1000 college students, how many would be expected to spend between 27 and 37 hours each week on social media?
- In a sample of 1000 college students, how many would be expected to spend more than 47 hours week on social media?
16%
50%
81.5%
17 to 47 hours
\(0.68 \cdot 1000 = 680\) college students
\(0.0015 \cdot 1000 = 1.5\)
About 2 of the 1000 college students would be expected to be on social media each week for more than 47 hours..