Statistics Unit
2.7 Measures of Central Tendency (Mean/Median/Mode/Midrange)
Find the mean, median, and midrange for each of these data sets:
- 1,1,2,2,7,9,9,9,9
- 6,6,7,7,7,7,8,8,9
- 1,4,8,8,8,9,9,9,9
- Which of these data sets have the same mean? same median? same midrange?
- If each data set represents a class set of quiz scores, which class did the best on the quiz? How do you know?
Mean: 5.4
Median: 7
Midrange: 5
Mean: 7.2
Median: 7
Midrange: 7.5
Mean: 7.2
Median: 8
Midrange: 5
#2 and #3 have the same mean.
#1 and #2 have the same median.
#1 and #3 have the same midrange.
The class in #3 did the best on the quiz because the median score is the highest of the three data sets.
Which of these data sets have the same median? Same mean? Same midrange?
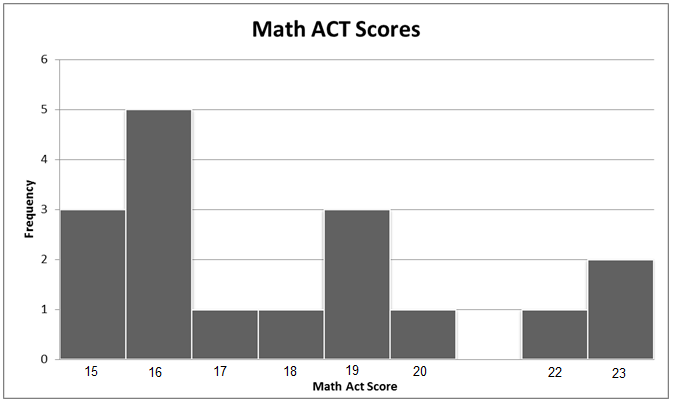
- Find the average (mean) math ACT score of the class.
- Find the median math ACT score of the class.
- Find the midrange of the math ACT scores of the class.
- Identify the mode of the math ACT scores of the class.
- Suppose a new student joined the class. The student’s math ACT score was a 35. How does this affect the mean, median, and midrange?
\( \begin{equation} \frac{(15 \times 3)+(16 \times 5)+(17 \times 1)+(18 \times 1)+(19 \times 3)+(20 \times 1)+(22 \times 1)+(23 \times 2)}{3+5+1+1+3+1+1+2}= \frac{305}{17}=17.9 \end{equation} \)
17
19
16
Mean: 18.9
Median: 17.5
Midrange: 25