Statistics Unit
2.9 Interpreting Box and Whisker Plots
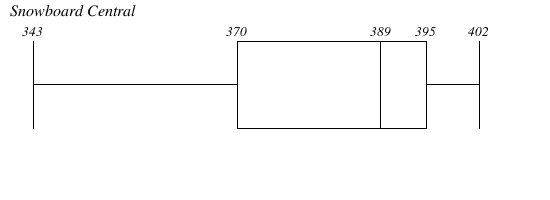
- Below are the prices of snowboards at two competing snowboard stores:
Middletown Snowboards Snowboard Central 345, 350, 356, 360, 375, 405 343, 370, 386, 392, 395, 402 - Identify the 5 number summary statistics of each set of data.
- Draw a double box-and-whisker plot of the above data on the scale below:
- What is the median price for a snowboard at Middletown Snowboards?
- What is the lowest price you could pay for a snowboard at Snowboard Central?
- What is the most expensive board at Middletown Snowboards?
- What is the range of prices for snowboards at Snowboard Central?
- Which price represents the 75th percentile for Middletown Snowboards?
- Which store would you rather buy a snowboard from? Why?
Middletown Snowboards Snowboard Central Low = 345
Lower Quartile = 350
Median = 358
Upper Quartile = 375
High = 405Low = 343
Lower Quartile = 370
Median = 389
Upper Quartile = 395
High = 402
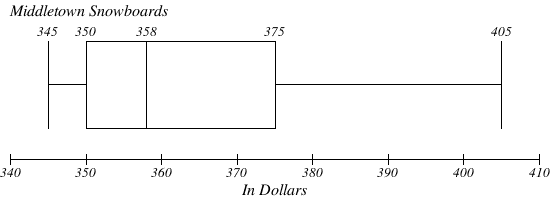
$358
$343
$405
$59
$375
Middletown Snowboards, because the majority of the prices are below the majority of the prices at Snowboard Central.
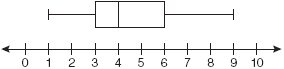
- The accompanying box-and-whisker plot represents the cost, in dollars, of twelve CD’s.
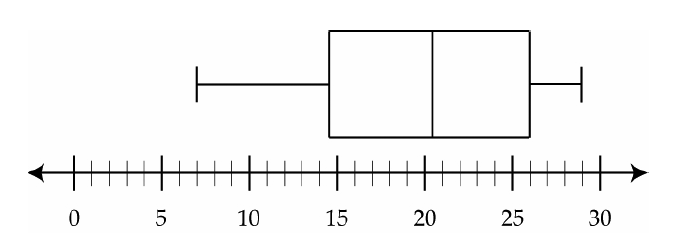
- Which cost is the upper quartile?
- What is the range of the costs of the CD’s?
- What is the median?
- Which cost represents the 100th percentile?
- How many CD’s cost between $14.50 and $26.00?
- How many CD’s cost less than $14.50?
$26
$22
$20.50
$29
6
3
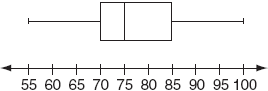
- The accompanying box-and-whisker plot represents the scores earned on a math test.
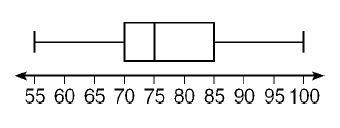
- What is the median score?
- 75
- 70
- 85
- 77
i. 75
- What score represents the first quartile?
- 55
- 70
- 100
- 75
ii. 70
- What statement is not true about the box and whisker plot shown?
- 75 represents the mean score
- 100 represents the maximum score
- 85 represents the 3rd quartile
- 55 represents the minimum score
i. 75 represents the mean score
- A score of an 85 on the box-and-whisker plot shown refers to:
- the third quartile
- the median
- the maximum score
- the mean
i. the third quartile
- What is the median score?
- What is the median price for a snowboard at Middletown Snowboards?
- 70
- 75
- 77
- 85
b. 75
- What percentage of values in the data set shown are greater than 6?
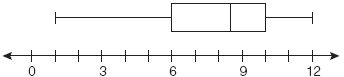
- 25%
- 50%
- 75%
- 100%
c. 75%
-
A movie theater recorded the number of tickets sold daily for a popular movie during the month of June. The box-and-whisker plot shown below represents the data for the number of tickets sold, in
hundreds.
Which conclusion can be made using this plot?
- The second quartile is 600.
- The mean of the attendance is 400.
- The range of the attendance is 300 to 600.
- Twenty-five percent of the attendance is between 300 and 400.
d. Twenty-five percent of the attendance is between 300 and 400.
- The accompanying box-and-whisker plots can be used to compare the annual incomes of three professions.
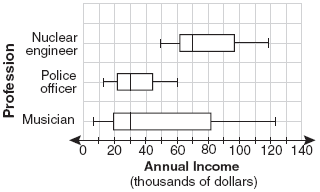
Based on the box-and-whisker plots, which statement is true?
- The median income for nuclear engineers is greater than the income of all musicians.
- The median income for police officers and musicians is the same.
- All nuclear engineers earn more than all police officers.
- A musician will eventually earn more than a police officer.
b. The median income for police officers and musicians is the same.
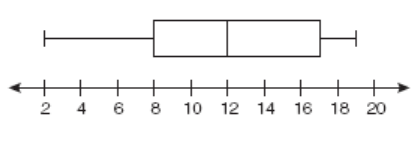
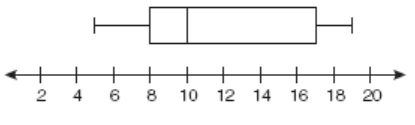
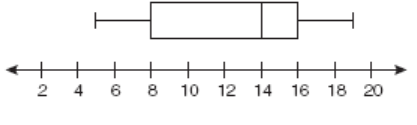
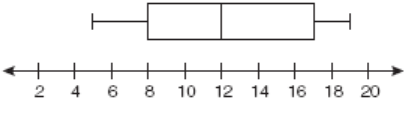
- The data set 5, 6, 7, 8, 9, 9, 9, 10, 12, 14, 17, 17, 18, 19, 19 represents the number of hours spent on the Internet in a week by students in a mathematics class. Which box-and-whisker plot represents the data?
b