MATH 1830 Notes
Mary Monroe-Ellis
Susan Mosteller
Unit 3 Applications of Derivatives
3.1 Analyzing and Interpreting Graphs
Introduction
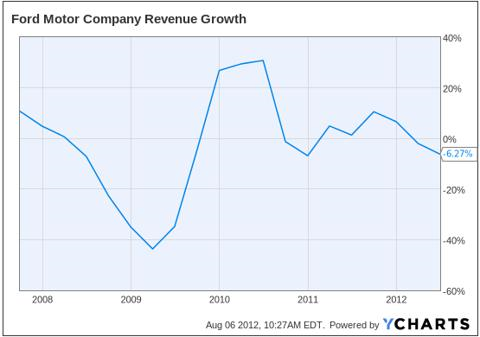
Discuss this graph with your group. Be prepared to share your observations with the class.
Notes
Curve Sketching
Preliminary Algebraic Analysis of the Function
Use Algebra and Limits to Identify All Basic Components in the Graph of $f(x)$
- Identify the Domain of $f(x)$: Commonly, $f(x)$is undefined for at any x value where:
- The denominator equals zero
- There is an even root of a negative number
- There is a logarithm of a negative number or log of zero
- Identify x-intercepts and y-intercept of $f(x)$
- x-intercepts: Set $y = 0$ and solve for $x$
- y-intercept: Set $x = 0$ and solve for $y$
- Identify Vertical Asymptotes and Holes of $f(x)$
- Vertical asymptote at $a$ when $\mathop {\lim }\limits_{x \to a }f\left( x \right) = \frac{n}{0}$ if $n \ne 0$
- Hole at $a$ when $\mathop {\lim }\limits_{x \to a }f\left( x \right) = \frac{0}{0}$ and then, after factoring and reducing, $\mathop {\lim }\limits_{x \to a }f\left( x \right) = \frac{n}{0}$ if $n \ne 0$
- Identify Horizontal Asymptote of $f(x)$: calculate $\mathop {\lim }\limits_{x \to \infty } f\left( x \right)$
First Derivative Test
Analyze $f'(x)$ to Identify Intervals of Increase/Decrease and Extrema on the Graph of $f(x)$
- Find $f'(x)$
- Identify all critical numbers and partitions for the function.
- Values of $x$ where$f'(x)=0$ are critical numbers.
- Values of $x$ where $f'(x)$ is undefined are partitions.
- Values of $x$ where $f(x)$ is undefined are partitions.
- Graph the critical numbers and partitions on a number line, separating the number line into intervals.
- Determine the intervals on which $f(x)$ is increasing /decreasing
- Test one point contained in the interval (do not use the end points of the interval).
- $f'(x)<0$ then the function $f(x)$ is DECREASING on the interval
- $f'(x)>0$ then the function $f(x)$ is INCREASING on the interval
- Identify local maxima and minima of $f(x)$ using the First Derivative Test.
- On the interval $(a,c)$, a local maximum occurs at $f(b)$ when $f(x)$ is increasing for all $x$ in the interval $(a,b]$ and $f(x)$ is decreasing for all $x$ in the interval $[b,c)$.
- On the interval $(a,c)$, a local minimum occurs at $f(b)$ when $f(x)$ is decreasing for all $x$ in the interval $(a,b]$ and $f(x)$ is increasing for all $x$ in the interval $[b,c)$.
Second Derivative Test
Analyze $f''(x)$ to Identify Intervals of Concavity and Points of Inflection on the Graph of $f(x)$
- Find $f''(x)$
- Find the critical numbers for the function.
- Values of $x$ where $f''(x)=0$ are critical numbers.
- Values of $x$ where $f''(x)$ is undefined are partitions.
- Values of $x$ where $f(x)$ is undefined are partitions.
- Graph the critical numbers and partitions on a number line, separating the number line into intervals.
- Determine the intervals on which $f(x)$ is concave up or concave down.
- Test one point contained in the interval (do not use the end points of the interval).
- $f(x)$ is concave down on the interval if $f''(x)<0$.
- $f(x)$ is concave up on the interval if $f''(x)>0$.
- Identify inflection points of $f(x)$. A point of inflection occurs at $x=a$ when $f''(a)=0$ and $f''(x)$ changes concavity across $a$.
Graph the function $f(x)$
Use All Information to Graph the Function
- Determine the interval and scale for the x- and y-axes.
- Graph the asymptotes and holes.
- Graph the x- and y-intercepts.
- Graph the maxima, minima, and point(s) of inflection.
- Sketch the graph using the intervals where the function is increasing, decreasing, concave up and concave down.
The annual first quarter change in revenue for Apple, Inc. is given in the table below.
| Year | % Revenue Growth |
|---|---|
| 1998 | -12.2 |
| 2000 | 27.1 |
| 2002 | 4.5 |
| 2004 | 29.4 |
| 2006 | 34.4 |
| 2008 | 42.7 |
| 2010 | 65.4 |
| 2012 | 58.9 |
| 2014 | 4.7 |
| 2016 | -12.8 |
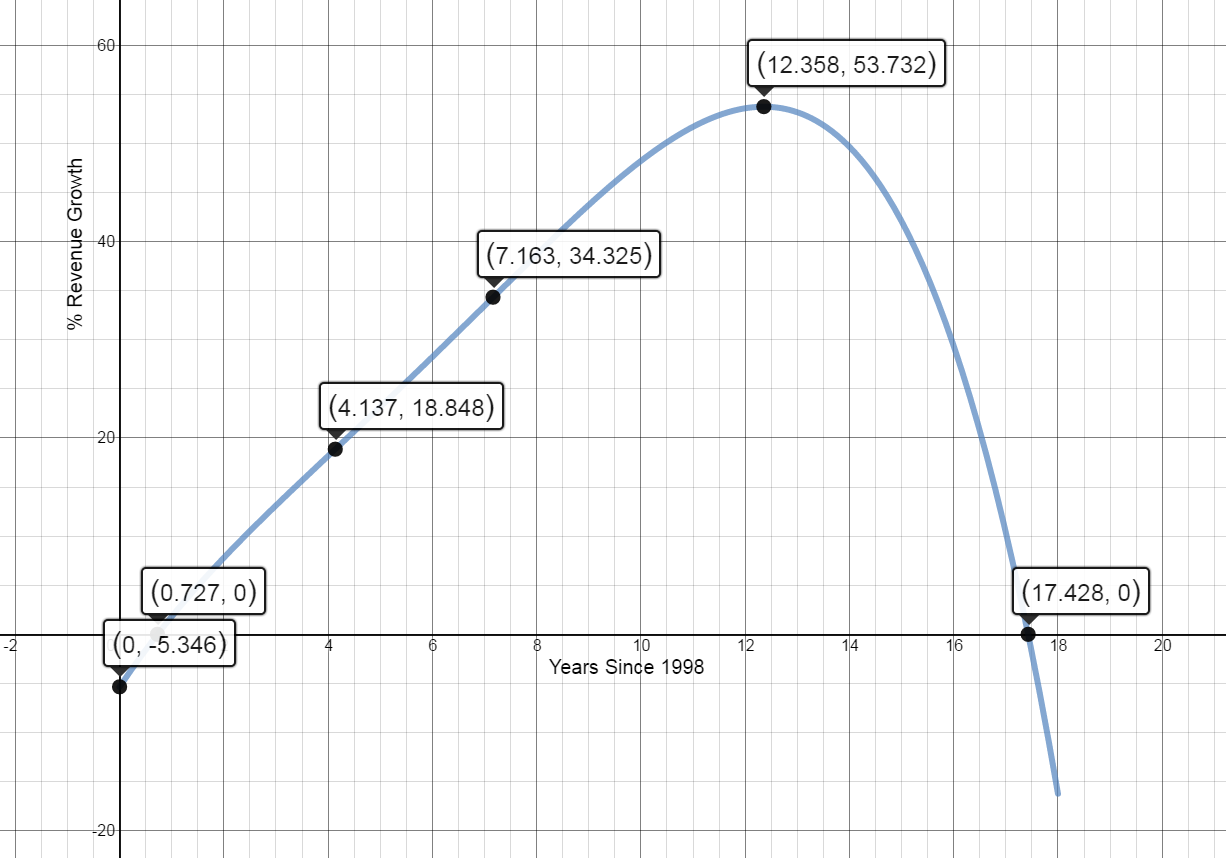
The regression model for this data is: $$f(x)=-0.005x^4+0.113x^3-0.889x^2+7.946x-5.346$$ where x is Years Since 1998.
Analyze and interpret the characteristics of the function identified below. Graph the function clearly marking each characteristic.
(Use graphing paper and colored pencils. Each graph should cover an entire piece of graph paper.)
- Use Algebra and Limits to Identify All Basic Components in the Graph of $f(x)$:
-
Identify the domain of $f(x)$:
[0,18]
This model shows 1st Quarter change in revenue from 1998 to 2016.
-
Identify all x-intercepts in the domain:
(from calculator): $\left(0.727,0\right)$ and $\left(17.428,0\right)$
In general this means the percent change in revenue was 0% when x=0.727 and x=17.428 years after 1998. Specifically for this data, the percent change in revenue was negative in 1998 and positive in 2000 and then was positive in 2014 and negative in 2016.
Identify the y-intercept, if $x=0$ is in the domain:
$\left(0,-5.346\right)$
In 1998 percent change in revenue was approximately -5.346%, according to the model. The percent change in revenue was actually -12.2% in 1998.
-
Identify all Asymptotes:
There are no vertical or horizontal asymptotes. This is a polynomial function.
-
- Analyze $f'(x)$ to Identify Intervals of Increase/Decrease and Extrema on the Graph of $f(x)$
$f'(x)=-0.02x^3+0.339x^2-1.778x+7.946$
-
Create the sign chart for $f'(x)$:
Identify the values of x where $f'(x)=0$:
$f'(x)=0$ at $x=12.358$
Values of x where $f'(x)$ is undefined
There are no values of x where $f'(x)$ is undefined.
Values of x where $f(x)$ is undefined
There are no values of x where $f(x)$ is undefined.
Separate the graph of $f'(x)$ into intervals using: $x=12.358$.
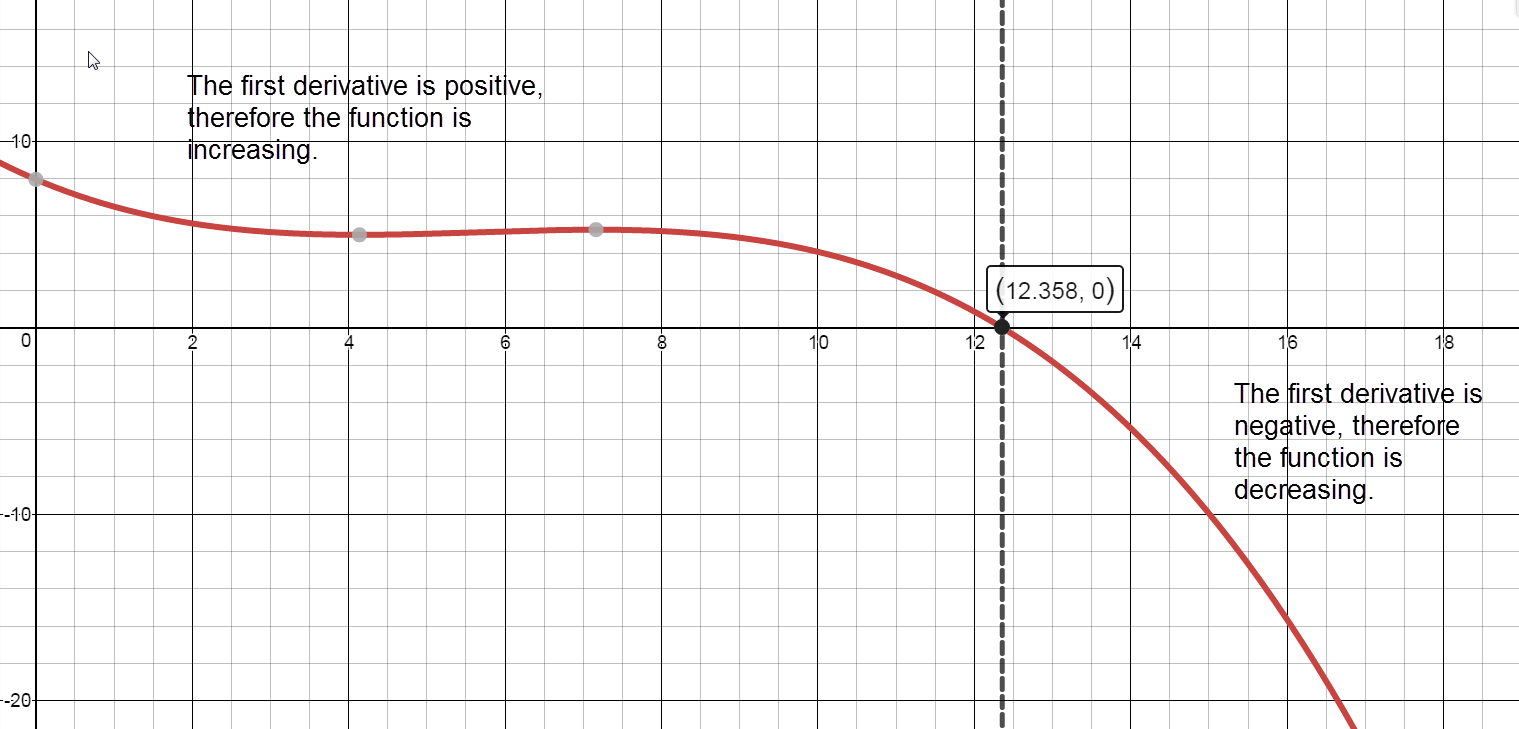
Sign graph of ${f}'(x)$ reading left to right: positive, ${f}'\left( 12.358 \right)=0$, negative
- Intervals of Increase and Intervals of Decrease
Increasing:
$[0,12.358)$
The percent change in revenue was increasing from 1998 into 2010.
Decreasing:$(12.358,18]$
The percent change in revenue was decreasing in 2010 through 2016.
- Extrema
Local maximum
$(12.358, 53.732)$
From the model, the maximum percent change in revenue occurs in 2010 (at x=12.358 years after 1998).
Local minimumThere are no local minima.
-
- Analyze $f''(x)$ to Identify Intervals of Concavity and Points of Inflection on the Graph of $f(x)$
$f''(x)=-0.06x^2+0.678x-1.778$
- Identify Critical Values and Partitions for the Sign Chart
Values of x where $f''(x)=0$
$f''(x)=0$ at $x= 4.137$ and $x= 7.163$
Values of x where $f''(x)$ is undefinedThere are no values of x where $f''(x)$ is undefined.
Values of x where $f(x)$ is undefinedThere are no values of x where $f(x)$ is undefined.
Separate into intervals using: $x=4.137$ and $x=7.163$.
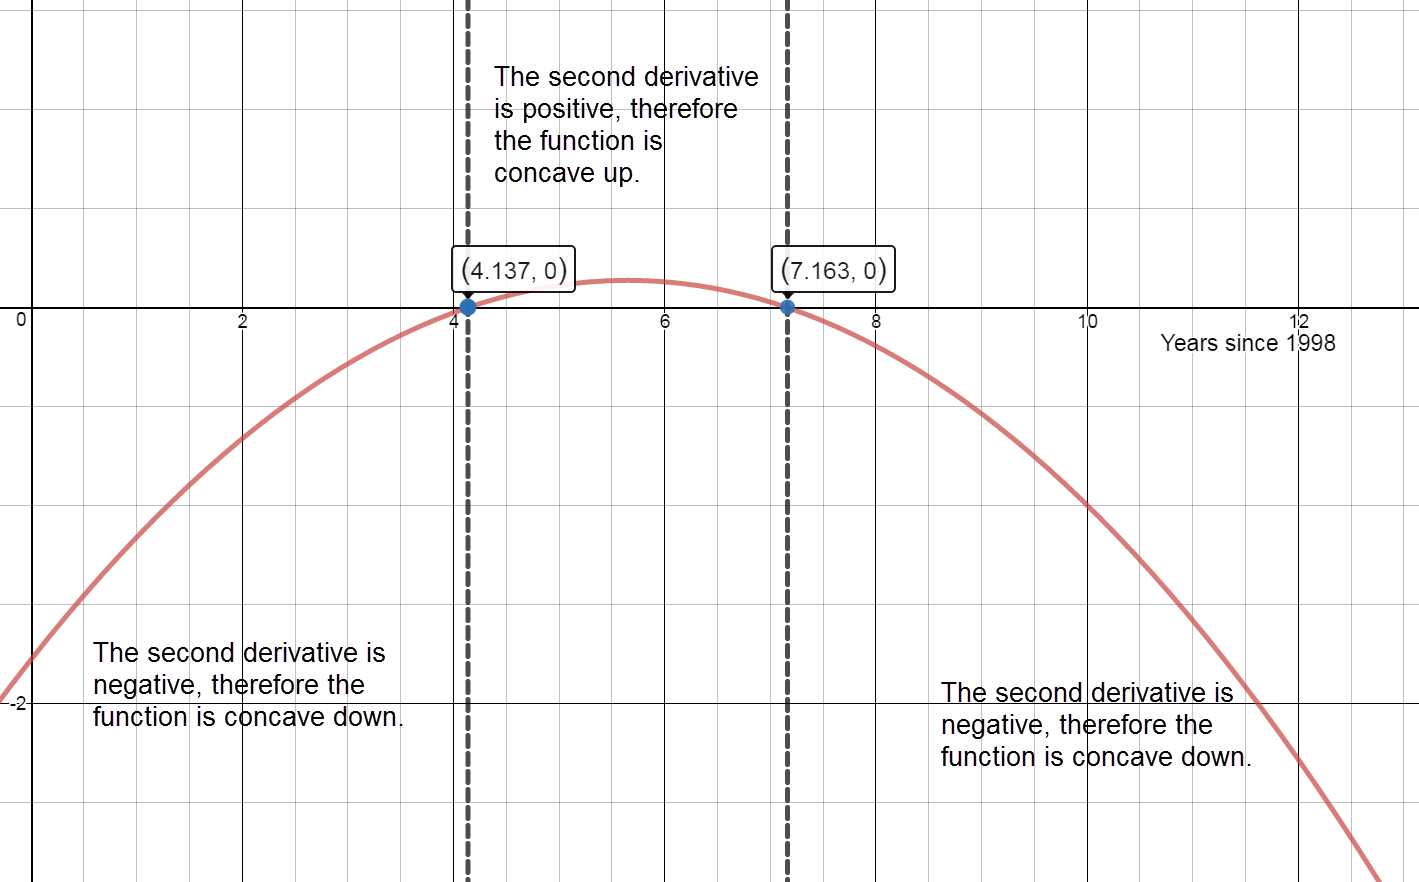
Sign graph of $f''(x)$ reading left to right: negative, ${f}'\left(4.137\right)=0,$ positive, ${f}'\left(7.163\right)=0,$ negative
- Intervals of Concavity
Concave Up:
$(4.137, 7.163)$
The percent change in revenue is increasing at an increasing rate from $x=4.137$ to $x=7.163$.
Concave down:$\lbrack0,\;4.137)\;\cup\;(7.163,\;18\rbrack$
The percent change in revenue is increasing at a decreasing rate from $x=0$ to $x=4.137$.
The percent change in revenue is increasing at a decreasing rate from $x=7.163$ to $x=12.358$ (the maximum) and decreasing at an increasing rate from $x=12.358$ to $x=18$.
- Inflection points:
$(4.137, 18.848)$ and $(7.163, 34.325)$
According to the model, the percent change in revenue is changing most rapidly at $x=4.137$ and $x=7.163$.
- Identify Critical Values and Partitions for the Sign Chart
- Graph $f(x)$
3.2 Analyzing and Interpreting Graphs Part 2
See Homework Assignment for 3.2
3.3 Curve Sketching
Analyze and interpret the characteristics of the function identified below. Graph the function clearly marking each characteristic. (Use graphing paper and colored pencils. Each graph should cover an entire piece of graph paper.)
-
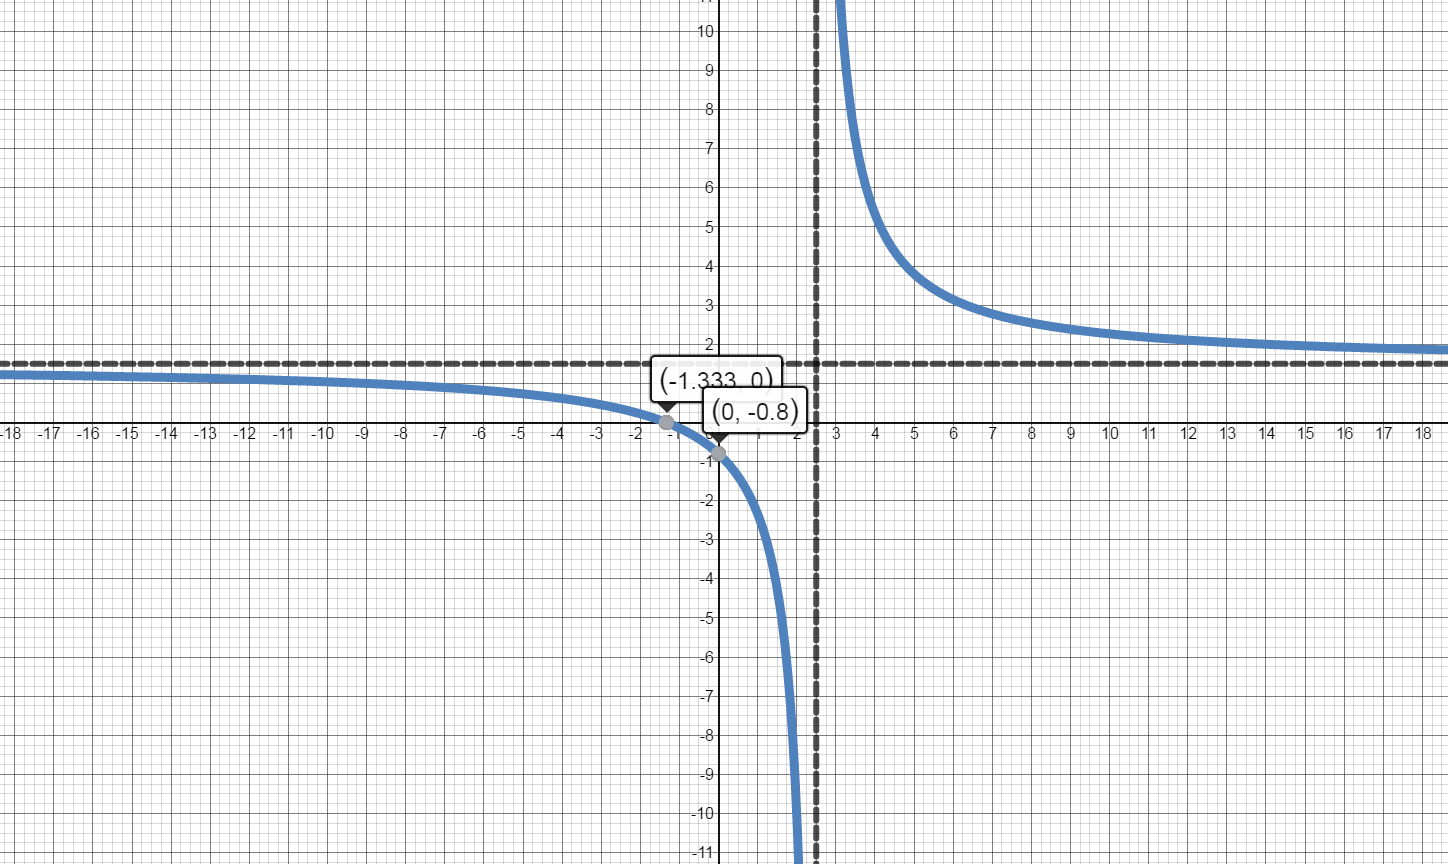
$f(x)=\frac{3x+4}{2x-5}$
Domain:
The domain will not contain x values where the denominator is equal to zero.
$ 2x-5\ne 0 $
$ x\ne \frac{5}{2}$
Domain: $\left( -\infty ,\frac{5}{2} \right)\cup \left( \frac{5}{2},\infty \right)$
x int(s):
$\frac{0}{1}=\frac{3x+4}{2x-5}$
$0=3x+4$
$ x=-\frac{4}{3}$
$\left( -\frac{4}{3},0 \right)$
y int:
$f\left( 0 \right)=\frac{3\left( 0 \right)+4}{2\left( 0 \right)-5}=-\frac{4}{5}$
$\left( 0,-\frac{4}{5} \right)$
Asymptotes:
Vertical:
$\mathop {\lim }\limits_{x \to \frac{5}{2}}f\left( x \right)=\frac{11.5}{0}$
There is a vertical asymptote at $x=\frac{5}{2}$.
Horizontal:
$\mathop {\lim }\limits_{x \to \infty }\frac{3x+4}{2x+5}=\mathop {\lim }\limits_{x \to \infty}\frac{3x}{2x}= \mathop {\lim }\limits_{x \to \infty}\frac{3}{2}=\frac{3}{2}$
There is a horizontal asymptote at $y=\frac{3}{2}$.
Increasing and Decreasing
${f}'\left( x \right)=\frac{3\left( 2x-5 \right)-2\left( 3x+4 \right)}{{{\left( 2x-5 \right)}^{2}}}=\frac{6x-15-6x-8}{{{\left( 2x-5 \right)}^{2}}}=\frac{-23}{{{\left( 2x-5 \right)}^{2}}}$
Values of x where ${f}'\left( x \right)=0:$
$\frac{0}{1}=\frac{-23}{{{\left( 2x-5 \right)}^{2}}}$
$-23 \neq 0$. There are no values of x where ${f}'\left( x \right)=0.$
Values of x where ${f}'\left( x \right)$ is undefined:
$2x-5=0$, $ x=\frac{5}{2}$
Values of x where $f\left( x \right)$ is undefined:
$2x-5=0$, $x=\frac{5}{2}$
Separate into intervals using: $x=\frac{5}{2}$.
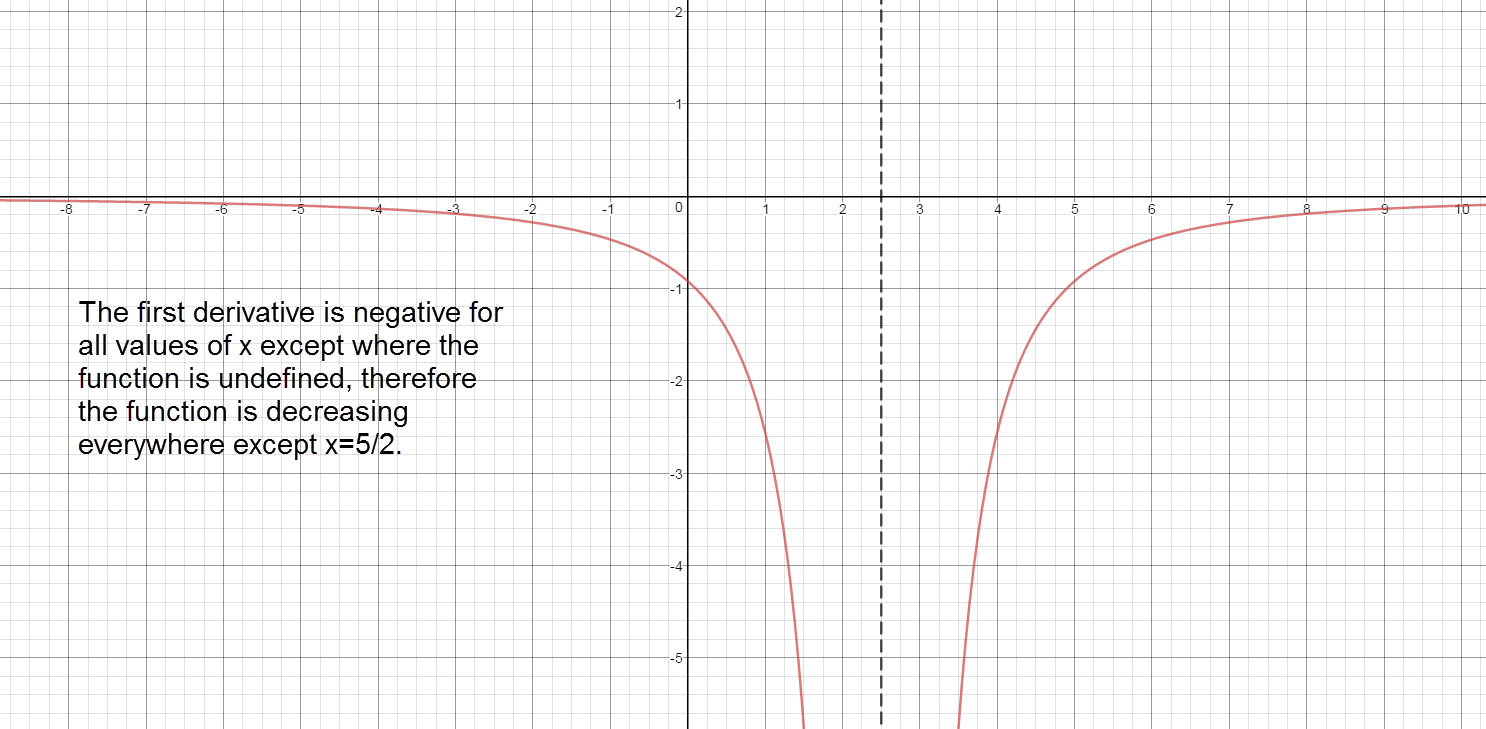
Sign graph of ${f}'(x)$ reading left to right: negative, ${f}'\left( \frac{5}{2} \right)\text{= undefined}$, negative
Increasing:
The graph of the first derivative is never above the x axis. Therfore, there are no intervals where $f(x)$ is increasing.
Decreasing:
$\left( -\infty ,\frac{5}{2} \right)\cup \left( \frac{5}{2},\infty \right)$ The graph of the first derivative is always below the x axis. Therefore, the function is decreasing over the entire domain.
Local Maxima:
The first derivative never changes from positive to negative. There are no local maxima.
Local Minima:
The first derivative never changes from negative to positive. There are no local minima.
Concave Up and Concave Down
${f}''\left( x \right)=-23\left( -2 \right){{\left( 2x-5 \right)}^{-3}}\left( 2 \right)=\frac{92}{{{\left( 2x-5 \right)}^{3}}}$
Values of x where ${f}''(x)=0$:
There are no values of x where ${f}''\left( x \right)=0$.
Values of x where ${f}''\left( x \right)$ is undefined:
$ 2x-5=0$
$ x=\frac{5}{2}$
Values of x where $f\left( x \right)$is undefined:
$2x-5=0$
$x=\frac{5}{2}$
Separate into intervals using: $x=\frac{5}{2}$.
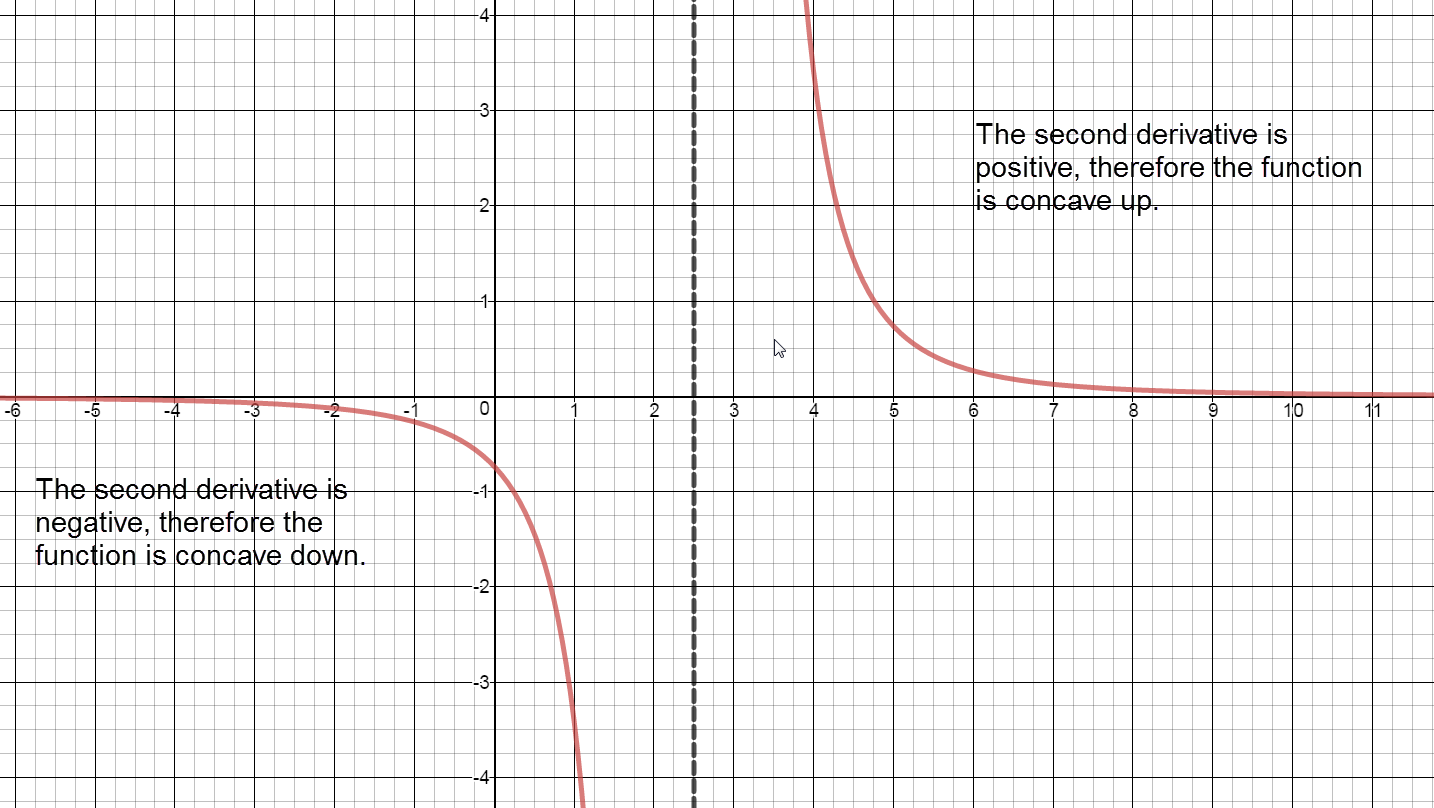
Sign chart for ${f}''\left( x \right)$: negative, ${f}''\left( \frac{5}{2} \right)=$ undefined, positive
Concave up:
The graph of $f(x)$ is concave up on the interval $\left( \frac{5}{2},\infty \right).$
Concave down:
The graph of $f(x)$ is concave down on the interval $\left( -\infty ,\frac{5}{2} \right).$
Inflection Points:
Even though the function changes from concave down to concave up at $x=\frac{5}{2}$, there are no points of inflection because the function is undefined at $x=\frac{5}{2}.$
-
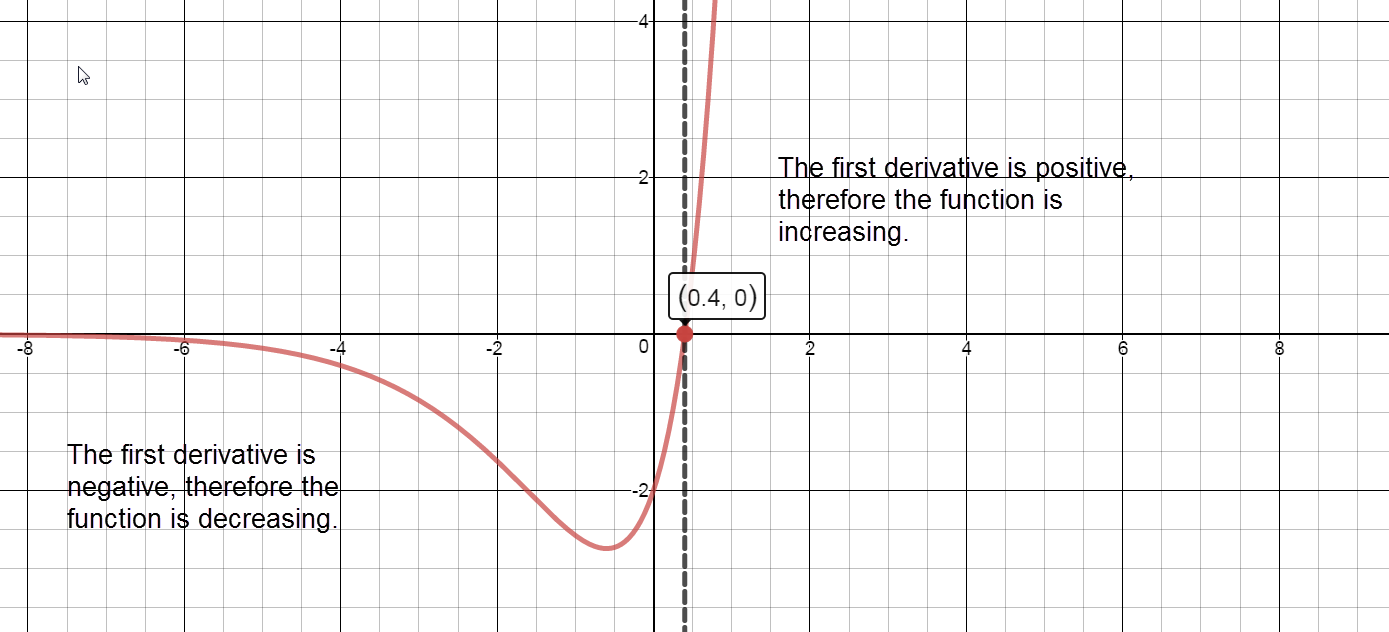
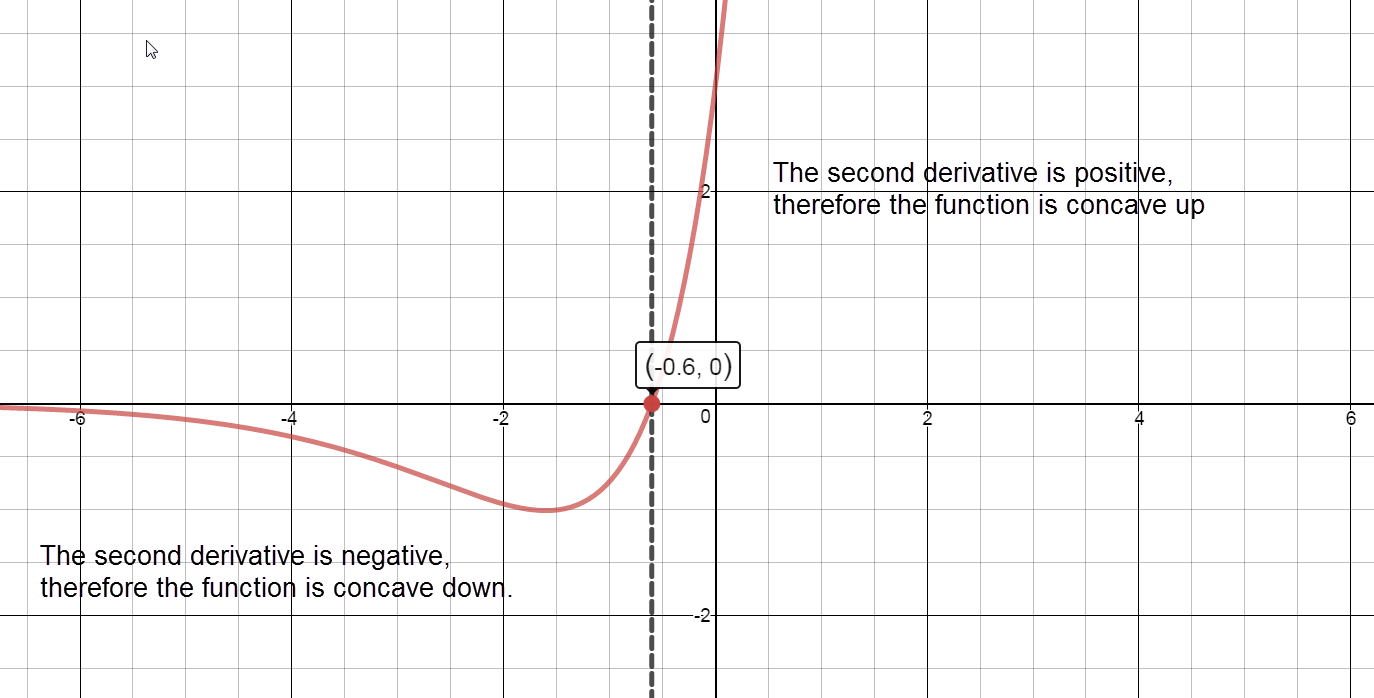
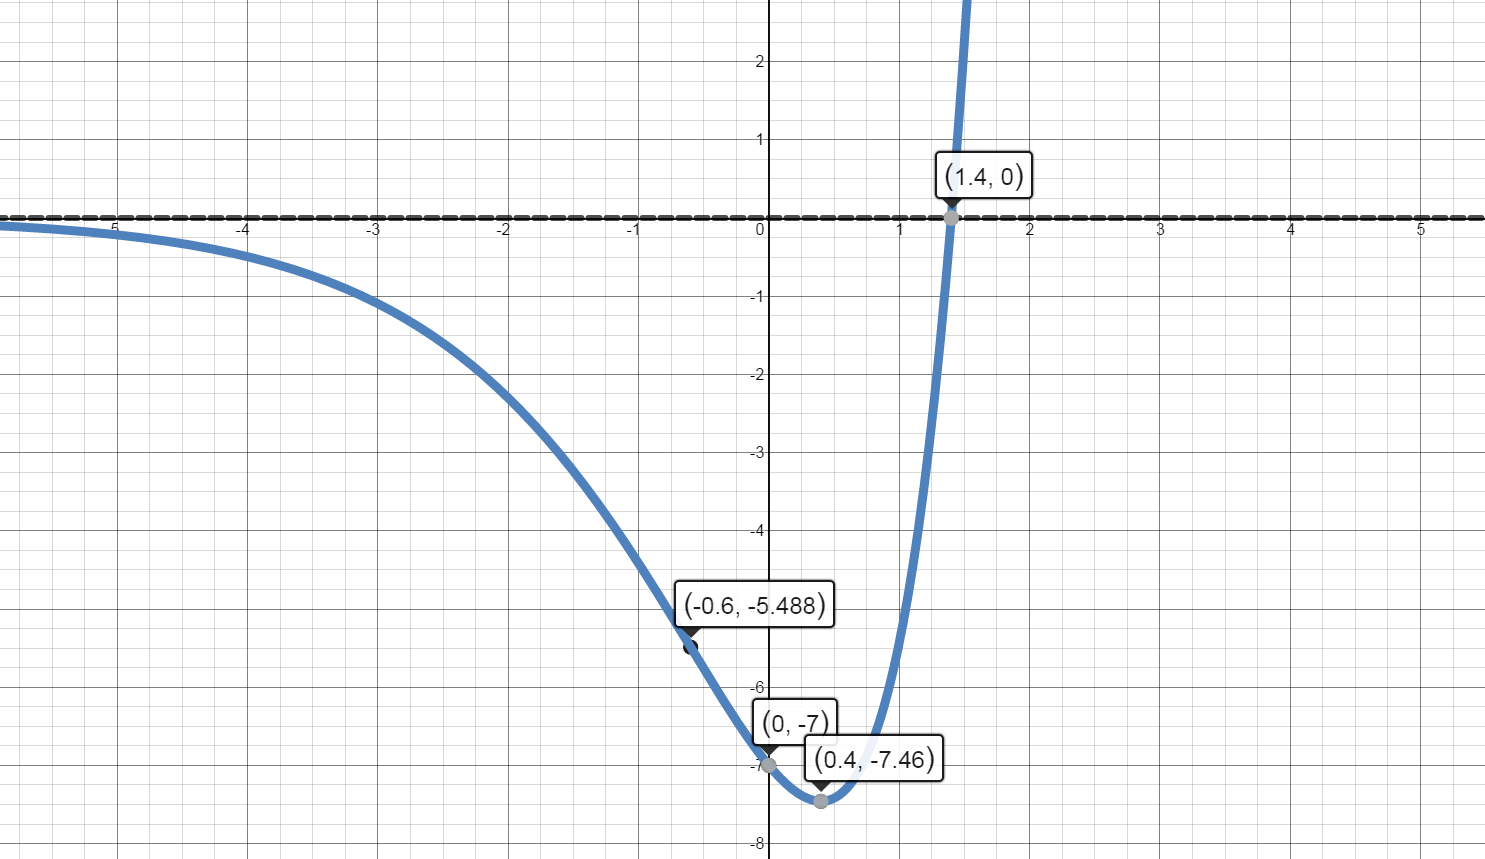
$f(x)={{e}^{x}}(5x-7)$
Domain:
$\left( -\infty ,\infty \right)$
x int(s):
$0={{e}^{x}}(5x-7)$
$5x-7=0$
$x=\frac{7}{5}$
${{e}^{x}}=0$
no solution
$\left( \frac{7}{5},0 \right)$
y int:
$f\left( 0 \right)={{e}^{0}}\left( 5\left( 0 \right)-7 \right)=-7$
$\left( 0,-7 \right)$
Asymptotes:
Vertical:
There are no vertical asymptotes. The function is continuous for all x.
Horizontal:
$\mathop {\lim }\limits_{x \to \infty }\left( {{e}^{x}}(5x-7) \right)=\infty $
$\mathop {\lim }\limits_{x \to -\infty }\left( {{e}^{x}}(5x-7) \right)=0$
There is a horizontal asymptote at $y=0$ on the left end of the graph.
Increasing and Decreasing
${f}'\left( x \right)={{e}^{x}}\left( 5x-7 \right)+5{{e}^{x}} $
$f’(x) ={{e}^{x}}\left( 5x-7+5 \right)$
$f’(x) ={{e}^{x}}\left( 5x-2 \right)$
Values of x where ${f}'\left( x \right)=0:$
${{e}^{x}}\left( 5x-2 \right)=0$
$e^x \ne 0$ and $x=\frac{2}{5}$
Values of x where ${f}'\left( x \right)\;$ is undefined: There are no values of x where ${f}'\left( x \right)\;$ is undefined.
Values of x where $f\left( x \right)\;$ is undefined: There are no values of x where $f\left( x \right)\;$ is undefined.
Separate into intervals using: $x=\frac{2}{5}$.
Sign graph of ${f}'(x)$ reading left to right: negative, ${f}'\left( \frac{2}{5} \right)=0$, positive
Increasing:
The graph of $f(x)$ is increasing on the interval $\left( \frac{2}{5},\infty \right).$
Decreasing:
The graph of $f(x)$ is decreasing on the interval $\left( -\infty ,\frac{2}{5} \right).$
Local Maxima:
There are no local maxima.
Local Minima:
$f\left( \frac{2}{5} \right)={{e}^{2/5}}\left( 5\left( \frac{2}{5} \right)-7 \right)\approx -7.46$
There is a local minimum at the point $\left( \frac{2}{5},-7.46 \right).$
Concave Up and Concave Down
${f}''\left( x \right)={{e}^{x}}\left( 5x-2 \right)+{{e}^{x}}\left( 5 \right)$
${f}''\left( x \right)={{e}^{x}}\left( 5x-2+5 \right)$
${f}''\left( x \right)={{e}^{x}}\left( 5x+3 \right)$
Values of x where ${f}''(x)=0:$
${{e}^{x}}\left( 5x+3 \right)=0$
$x=-\frac{3}{5}$
${{e}^{x}}\ne 0$
Values of x where ${f}''\left( x \right)\;$is undefined:
There are no values of x where ${f}''\left( x \right)\;$is undefined.
Values of x where $f\left( x \right)\;$is undefined:
There are no values of x where $f\left( x \right)\;$is undefined.
Separate into intervals using: $x=-\frac{3}{5}$.
Sign chart for ${f}''\left( x \right)$: negative, ${f}''\left( -\frac{3}{5} \right)=0$, positive
Concave up:
The graph of $f(x)$ is concave up on the interval $\left( -\frac{3}{5},\infty \right)$.
Concave down:
The graph of $f(x)$ is concave down on the interval $\left( -\infty ,-\frac{3}{5} \right)$.
Inflection Points:
$f\left( -\frac{3}{5} \right)={{e}^{-3/5}}\left( 5\left( -\frac{3}{5} \right)-7 \right)\approx -5.488$.
There is a point of inflection at $\left( -\frac{3}{5},-5.488 \right)$
-
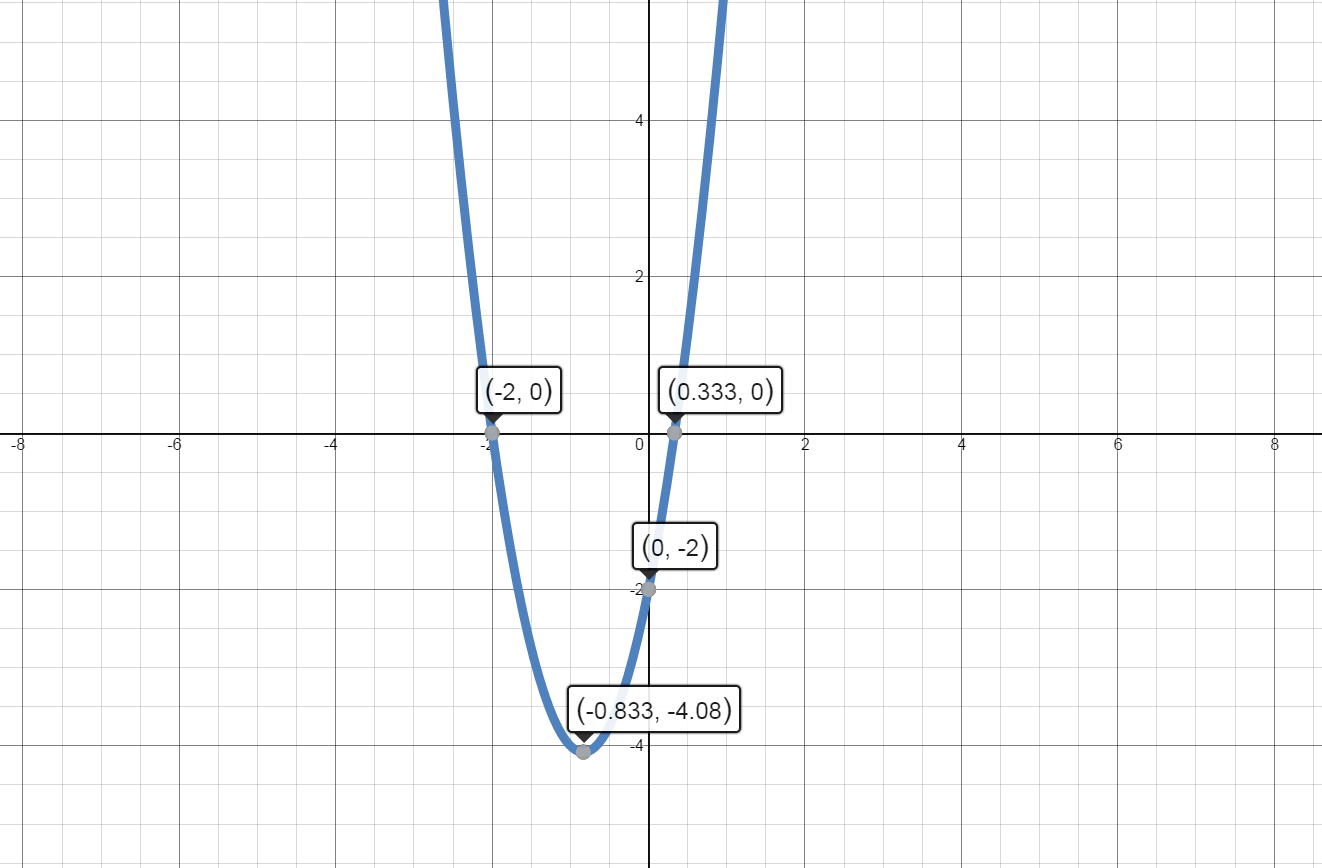
$f(x)=3{{x}^{2}}+5x-2$
Domain:
$\left( -\infty ,\infty \right)$
Polynomial functions are always continuous.
x int(s):
$ 0=3{{x}^{2}}+5x-2 $
$ 0=\left( 3x-1 \right)\left( x+2 \right) $
$x=\frac{1}{3}\,\,,\,\,x=-2$
$\left( \frac{1}{3},0 \right)\,\text{and}\,\left( -2,0 \right)$
y int:
$f\left( 0 \right)=0+0-2=-2$
$\left( 0,-2 \right)$
Asymptotes:
There are no asymptotes. The function is a polynomial.
Increasing and Decreasing
${f}'(x)=6x+5$
Values of x where ${f}'(x)=0:$
$6x+5=0$
$6x=-5$
$x=-\frac{5}{6}$
Values of x where ${f}''\left( x \right)\;$is undefined:
There are no values of x where ${f}''\left( x \right)\;$is undefined.
Values of x where $f\left( x \right)\;$is undefined:
There are no values of x where $f\left( x \right)\;$is undefined.
Separate into intervals using: $x=-\frac{5}{6}$.
Sign graph of ${f}'(x)$ reading left to right: negative, ${f}'\left( -\frac{5}{6} \right)=0$ , positive
Increasing:
The graph of $f(x)$ is increasing on the interval $\left( -\frac{5}{6},\infty \right)$.
Decreasing:
The graph of $f(x)$ is decreasing on the interval $\left( -\infty ,-\frac{5}{6} \right)$.
local max:
There are no local maxima.
local min:
$f\left( -\frac{5}{6} \right)=3{{\left( -\frac{5}{6} \right)}^{2}}+5\left( -\frac{5}{6} \right)-2\approx 4.08$
There is a local minimum at the point $\left( -\frac{5}{6},-4.08 \right)$.
Concave Up and Concave Down
${f}''\left( x \right)=6$
Values of x where ${f}''(x)=0:$
There are no values of x where ${f}"\left( x \right)=0.$
Values of x where ${f}''\left( x \right)$ is undefined:
There are no values of x where ${f}''\left( x \right)$ is undefined.
Values of x where $f\left( x \right)$ is undefined:
There are no values of x where $f\left( x \right)$ is undefined.
Because there are no x values that meet the requirements for a partition or critical value, $f(x)$ will maintain the same concavity across the entire domain.
Sign chart for ${f}''\left( x \right)$: positive on domain
Concave up:
The graph of $f(x)$ is concave up on the interval $\left( -\infty ,\infty \right)$.
Concave down:
There are no intervals where $f(x)$ is concave down.
Inflection Points:
There are no points of inflection.
-
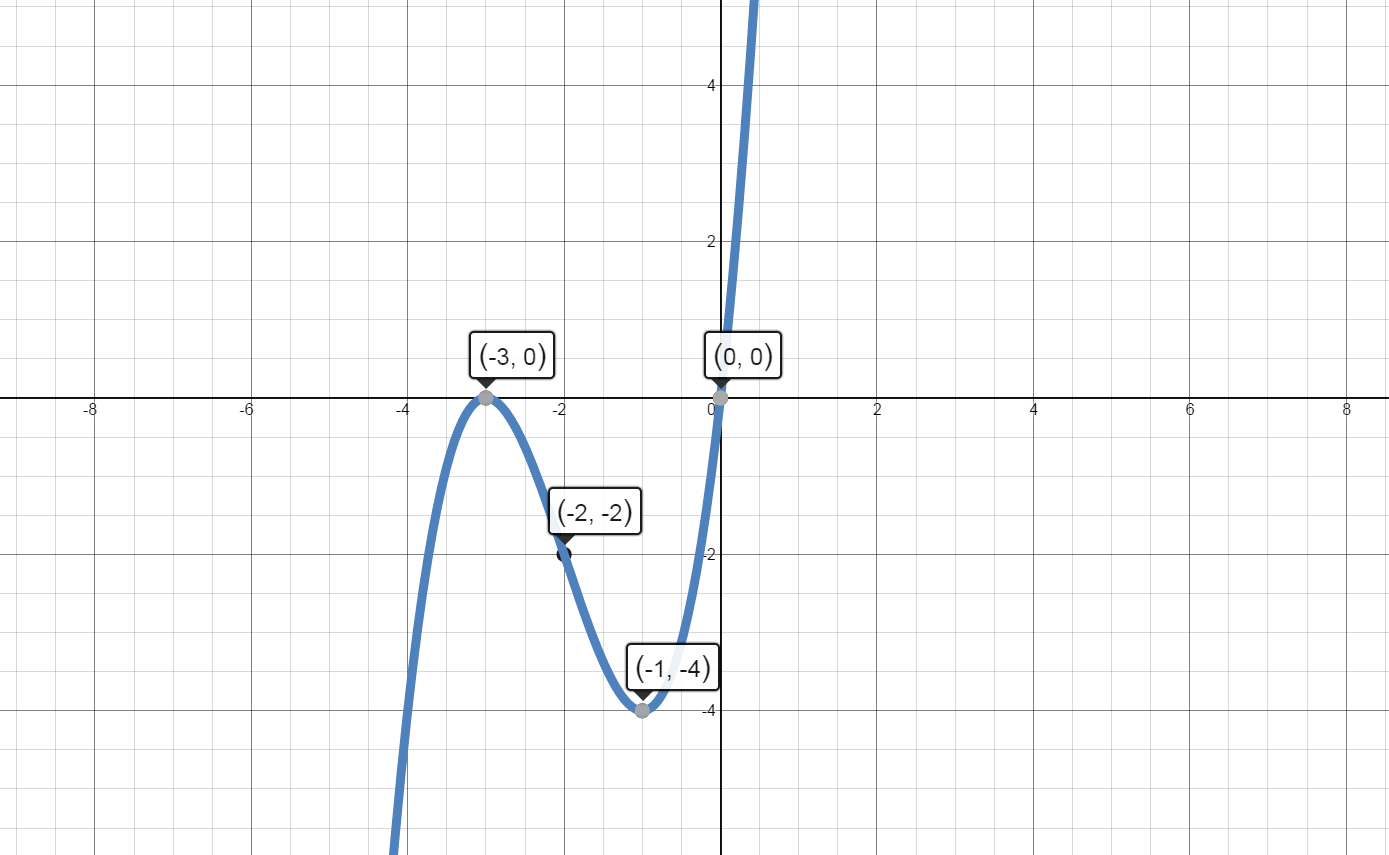
$f(x)={{x}^{3}}+6{{x}^{2}}+9x$
Domain:
$\left( -\infty ,\infty \right)$
Polynomial functions are always continuous.
x int(s):
${{x}^{3}}+6{{x}^{2}}+9x=0$
$x\left( {{x}^{2}}+6x+9 \right)=0 $
$x{\left( x+3 \right)}{\left( x+3 \right)}=0 $
$x=0\,\,,\,\,x=-3$
$\left( 0,0 \right)\,\text{and}\,\left( -3,0 \right)$
y int:
$f\left( 0 \right)={{\left( 0 \right)}^{3}}+6{{\left( 0 \right)}^{2}}+9\left( 0 \right)=0$
$\left( 0,0 \right)$
Asymptotes:
There are no asymptotes. The function is a polynomial.
Increasing and Decreasing
${f}'(x)=3{{x}^{2}}+12x+9$
Values of x where ${f}'(x)=0: $3{{x}^{2}}+12x+9=0$
$3\left( x+3 \right)\left( x+1 \right)=0$
$3 \neq 0$, $x=-3$ and $x=-1$
Values of x where ${f}'\left( x \right)$ is undefined:
There are no values of x where ${f}'\left( x \right)$ is undefined.
Values of x where $f\left( x \right)$ is undefined:
There are no values of x where $f\left( x \right)$ is undefined.
Separate into intervals using: $x=-3$ and $x=-1$.
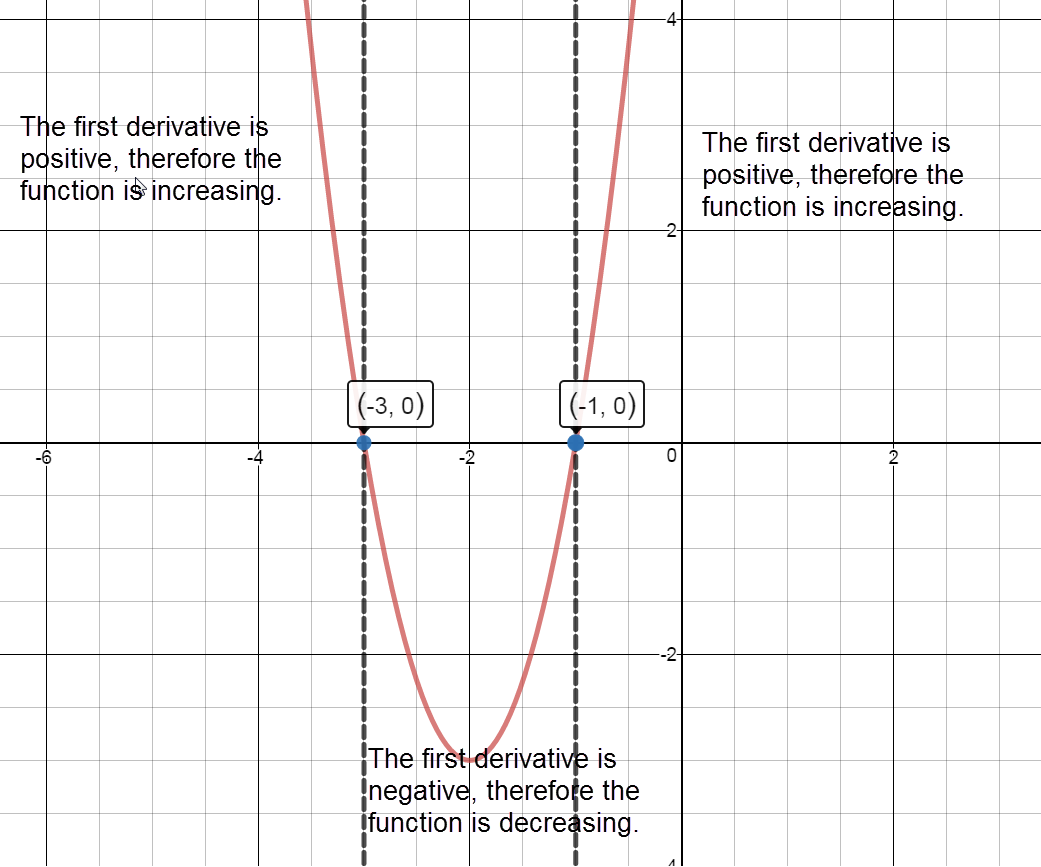
Sign graph of ${f}'(x)$ reading left to right: positive, ${f}'\left( -3 \right)=0$, negative, ${f}'\left( -1 \right)=0$, positive
Increasing:
The graph of $f(x)$ is increasing on the intervals $\left( -\infty ,-3 \right)\cup \left( -1,\infty \right)$.
Decreasing:
The graph of $f(x)$ is decreasing on the interval $\left( -3,-1 \right)$.
Local Maxima:
$f\left( -3 \right)={{\left( -3 \right)}^{3}}+6{{\left( -3 \right)}^{2}}+9\left( -3 \right)=0$
There is a local maximum at the point $\left( -3,0 \right)$.
Local Minima:
$f\left( -1 \right)={{\left( -1 \right)}^{3}}+6{{\left( -1 \right)}^{2}}+9\left( -1 \right)=-4$
There is a local minimum at the point $\left( -1,-4 \right)$.
Concave Up and Concave Down
${f}''(x)=6x+12$
Values of x where ${f}''(x)=0:$
$6x+12=0$
$6x=-12$
$x=-2$
Values of x where ${f}''\left( x \right)$ is undefined:
There are no values of x where ${f}''\left( x \right)$ is undefined.
Values of x where $f\left( x \right)$ is undefined:
There are no values of x where $f\left( x \right)$ is undefined.
Separate into intervals using: $x=-2$.
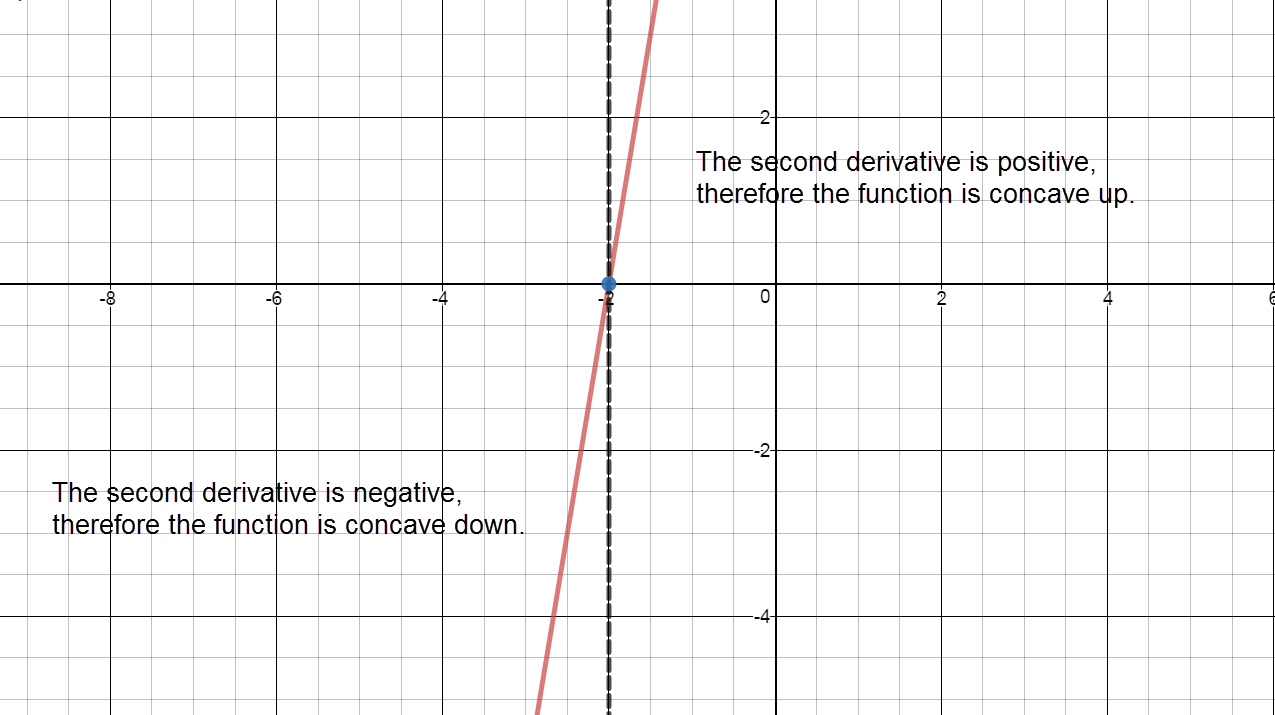
Sign chart for ${f}''\left( x \right)$: negative, ${f}''\left( -2 \right)=0$, positive
Concave up:
The graph of $f(x)$ is concave up on the interval $\left( -2,\infty \right)$.
Concave down:
The graph of $f(x)$ is concave down on the interval $\left( -\infty ,-2 \right)$.
Inflection Points:
$f\left( -2 \right)={{\left( -2 \right)}^{3}}+6{{\left( -2 \right)}^{2}}+9\left( -2 \right)=-2$.
The graph of $f(x)$ has a point of inflection at $\left( -2,-2 \right)$
3.4 Introduction to Optimization
Introduction
-
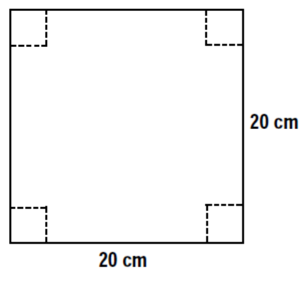
Construct a 20 cm by 20 cm square on the white piece of paper.
-
Draw four congruent squares in each corner of your original square (see diagram below), the size of the four squares you draw will be assigned for your group.
-
Using the scissors and tape, cut out your square and its corners to create an open-topped box.
-
Complete the following questions:
- The width of our box is:
- The length of our box is:
- The height of our box is:
- Calculate the volume of your box.
A summary of the data collected from the class is on the board. Copy this data into the chart below.
Height (cm) Volume (cubic cm) 0 0 1 2 3 4 5 6 7 8 9 10 0 -
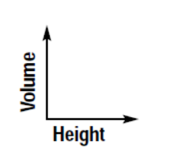
Using the graph paper, construct a graph of height vs volume by plotting the above ordered pairs. Join the points with a smooth curve. Answer the following questions based on your graph.
-
What is the maximum volume? (According to your graph.)
-
What size of square cut out of the corner would result in the maximum volume?
-
What type of function models your graph?
-
Could we write a mathematical function representing the graph?
-
How could our knowledge of derivatives be used to find the maximum volume?
3.5 Modeling Optimization
Notes
Write a mathematical function for each of the following.
Be sure to include a properly labeled diagram (if applicable) and variable statements. State the restrictions on the independent variable.
-
Find the formula for volume of an open-topped box created from a 20 cm square sheet of paper.
$V=l\cdot w\cdot h$
$V=\left( 20-2h \right)\left( 20-2h \right)h$
$V=\left( 400-40h-40h+4{{h}^{2}} \right)h$
$V=\left( 400-80h+4{{h}^{2}} \right)h$
$V=400h-80{{h}^{2}}+4{{h}^{3}}$
-
Determine the formula for the distance from A to B through E.
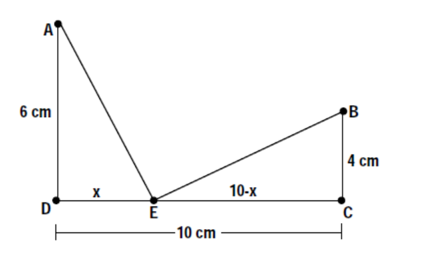
$\left(m\overline{AE}\right)^2={{x}^{2}}+{{6}^{2}}$
$m{\overline{AE}}=\sqrt{{{x}^{2}}+36}$
$\left(m\overline{BE}\right)^2={{\left( 10-x \right)}^{2}}+{{4}^{2}}$
$\left(m\overline{BE}\right)^2=\left( 100-20x+{{x}^{2}} \right)+16$
$\left(m\overline{BE}\right)^2=116-20x+{{x}^{2}}$
$m{\overline{BE}}=\sqrt{116-20x+{{x}^{2}}}$
$m{\overline{AE}}+m{\overline{BE}}=\sqrt{{{x}^{2}}+36}+\sqrt{116-20x+{{x}^{2}}}$
-
When a theater owner charges \$3 for admission, there is an average attendance of 100 people. For every \$0.10 increase in admission, there is a loss of 1 customer from the average number. Find the revenue formula.
$R(x)=$(price per ticket)(number of tickets sold)
$R(x)=(3+0.10x)(100-1x)$
$R(x)=300-3x+10x-0.1{{x}^{2}}$
$R(x)=300+7x-0.1{{x}^{2}}$
-
A Norman window is a rectangle with a semi-circle on top. If the perimeter is 24 feet, express the area as a function of the radius (r).
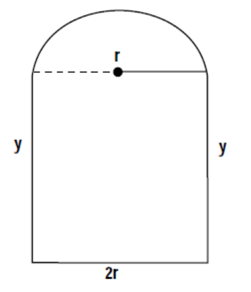
$P=2y+2r+\frac{1}{2}\left( 2\pi r \right)$
$24=2y+2r+\frac{1}{2}(2\pi r)$
$24=2y+2r+\pi r$
$24-2r-\pi r=2y$
$\frac{24-2r-\pi r}{2}=y$
$A=$ area of rectangle $+ \frac{1}{2}$ area of circle
$A=l\cdot w+\frac{1}{2}\pi {{r}^{2}}$
$A=\left( \frac{24-2r-\pi r}{2} \right)2r+\frac{1}{2}\pi {{r}^{2}}$
$A=\left( 24-2r-\pi r \right)r+\frac{1}{2}\pi {{r}^{2}}$
$A=24r-2{{r}^{2}}-\pi {{r}^{2}}+\frac{1}{2}\pi {{r}^{2}}$
$A=24r-2{{r}^{2}}-\frac{1}{2}\pi {{r}^{2}}$
Norris, Ken. (1999). Optimization Problems. Retrieved from https://www.stf.sk.ca/portal.jsp?Sy3uQUnbK9L2RmSZs02CjV/Lfyjbyjsxsd+sU7CJwaIY=F
-
A lifeguard has 200 m of rope and some buoys with which she intends to enclose a rectangular area at a lake for swimming. The beach will form one side of the rectangle, with the rope forming the other three sides. Find the formula for the area of the enclosure.
$A=l\cdot w$
$A=x(200-2x)$
$A=200x-2{{x}^{2}}$
3.6 Absolute Maximum and Minimum
Introduction
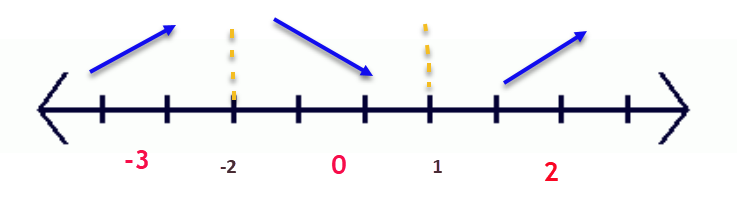
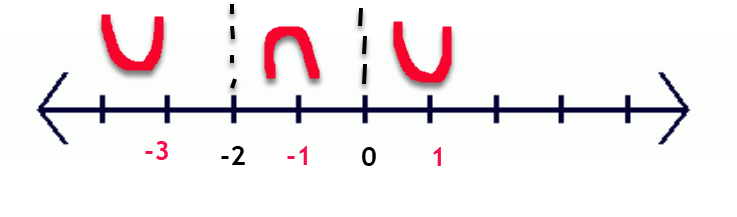
On a sheet of paper, each member of the group is to draw 3 functions f(x) over an interval a < x < b.
Be creative! Try to draw as many different possibilities as you can.
I have drawn one for you as an example.
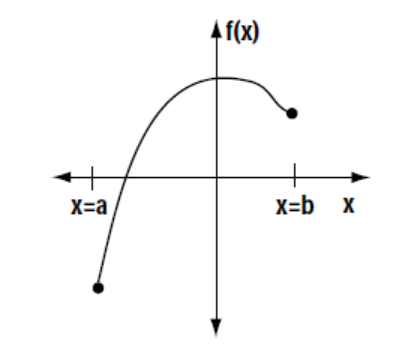
Label each of your graphs (ex: graph #1, graph #2, etc)
For each of your graphs, answer the following questions:
-
Where does f (x) have its maximum value? That is, where on your graph does y have the largest value?
-
Where does f (x) have its minimum value?
Clearly indicate the answers to these two questions on each graph.
-
Based on your answers above, can your group arrive at a conclusion?
- Could you make a general statement about how to determine the absolute maximum or minimum values of a function over a given interval?
- Can you think of any exceptions?
- How can our knowledge of derivatives assist us?
- Summarize your responses on this sheet. Be prepared to share your results to the rest of the class.
Norris, Ken. (1999). Optimization Problems. Retrieved from https://www.stf.sk.ca/portal.jsp?Sy3uQUnbK9L2RmSZs02CjV/Lfyjbyjsxsd+sU7CJwaIY=F
Notes
Algorithm for Determining Extreme Values
Suppose that $f(x)$ is a continuous function over a closed interval [a, b].
To find the absolute maximum and minimum values of the function $f(x)$ on [a, b]:
- Find $f'(x)$.
- Determine the critical points of $f'(x)$ in [a, b]
(that is, find all x values for which $f'(x)=0$, $f'(x)$ does not exist, or $f(x)$ does not exist).
- List the critical points of $f(x)$ and the endpoints of the interval [a & b].
- Find the function values of critical points and the endpoints.
- The largest of these values is the absolute maximum of on the interval [a, b].
- The smallest of these is the absolute minimum of on the interval [a, b].
Find the absolute minimum and maximum values of the function, if they exist, over the given interval.
-
$f(x)={{x}^{2}}-6x-3\quad \quad [-1,5]$
$ f'(x)=2x-6 $
Criticals: $f'(x)=0 $
$ 2x-6=0 $
$ 2x=6 $
$ x=3 $
Calculate $f(x)$ for the interval endpoints: ($x=-1, 5$), and critical values: ($x=3$).
$x$ $f(x)$ -1 $ 4$ 3 $ -12 $ $5$ $ -8 $ The Absolute Maximum on the interval is: $(-1, 4)$.
The Absolute Minimun on the interval is: $(3, -12)$.
-
$f(x)=2{{x}^{3}}-3{{x}^{2}}-36x+62\quad \quad [-3,4]$
$ f'(x)=6{{x}^{2}}-6x-36 $
$ 6{{x}^{2}}-6x-36=0 $
$ 6\left( {{x}^{2}}-x-6 \right)=0 $
$ 6(x+2)(x-3)=0 $
$ x=-2$, and $x=3$
Calculate $f(x)$ for the interval endpoints: ($x=-3$ and $x= 4$), and critical values: ($x=-2$ and $x=3$).
$x$ $f(x)$ -3 $ 89$
-2 $106 $
3 $-19 $
4 $-2$
The Absolute Maximum on the interval is: $(-2, 106)$.
The Absolute Minimum on the interval is: $(3, -19)$.
-
$f(x)=x+\frac{1}{x}\quad \quad [1,20]$
$ f(x)=x+{{x}^{-1}} $
$ f'(x)=1+(-1){{x}^{-2}} $
$ f'(x)=1-\frac{1}{{{x}^{2}}} $
$ 0=1-\frac{1}{{{x}^{2}}} $
$ \frac{1}{{{x}^{2}}}=1 $
$ {{x}^{2}}=1 $
$ \sqrt{{{x}^{2}}}=1 $
$ x=1\text{ and }x=-1 $
Calculate $f(x)$ for the interval endpoints: ($x=1$ and $x20$), and critical values: ($x=20$).
Do not include the critical value $x=-1$ because it is not in interval.
$x$ $f(x)$ 1 $2$
20 $20.05$
The Absolute Maximum on the interval is: $(20, 20.05)$.
The Absolute Minimum on the interval is: $(1, 2)$.
-
$f(x)=\frac{{{x}^{2}}}{{{x}^{2}}+1}\quad \quad [-2,2]$
$ f'(x)=\frac{({{x}^{2}}+1)(2x)-{{x}^{2}}(2x)}{{{\left( {{x}^{2}}+1 \right)}^{2}}} $
$ f'(x)=\frac{2{{x}^{3}}+2x-2{{x}^{3}}}{{{\left( {{x}^{2}}+1 \right)}^{2}}} $
$ f'(x)=\frac{2x}{{{\left( {{x}^{2}}+1 \right)}^{2}}} $
$ \frac{2x}{{{\left( {{x}^{2}}+1 \right)}^{2}}}=\frac{0}{1} $
$ 2x=0 $
$ x=0 $
Calculate $f(x)$ for the interval endpoints: ($x=-2$ and $x=2$), and critical values: ($x=0$).
$x$ $f(x)$ -2 $0.8$
0 $0$
2 $0.8$
The Absolute Maxima on the interval are: $(2, 0.8)$ and $(-2, 0.8)$.
The Absolute Minimum on the interval is: $(0, 0)$.
-
$f(x)=\frac{x}{{{(x+9)}^{2}}}\quad \quad [-1,8]$
$ f'(x)=\frac{{{\left( x+9 \right)}^{2}}(1)-x(2)(x+9)(1)}{{{\left( x+9 \right)}^{4}}} $
$f'(x)=\frac{\left( x+9 \right)\left[ \left( x+9 \right)-2x \right]}{{{\left( x+9 \right)}^{4}}}$
$f'(x)=\frac{\left( x+9 \right)-2x}{{{\left( x+9 \right)}^{3}}}$
$f'(x)=\frac{-x+9}{{{\left( x+9 \right)}^{3}}} $
$ \frac{-x+9}{{{\left( x+9 \right)}^{3}}}=\frac{0}{1} $
$ -x+9=0 $
$ 9=x $
Calculate $f(x)$ for the interval endpoints: ($x=-1$ and $x=8$).
Do not include the critical value $x=9$ because it is not in the interval.
$x$ $f(x)$ -1 $-.0156$
8 $.0227$
The Absolute Maximum on the interval is: $(8, .0277)$.
The Absolute Minimum on the interval is: $(-1, -.0156)$.
-
$f(x)=-3\quad \quad [-2,2]$
$f'(x)= 0$
There are no maximum or minimum values becasue this is a constant function.
-
An employee’s monthly production $M$, in number of units produced, is found to be a function of the number of year of service, $t$. For a certain product, a productivity function is being given by: $M(t)=-2{{t}^{2}}+100t+180,\quad 0\le t\le 40$
Find the maximum productivity and the year in which it is achieved.
$M'(t)=-4t+100$
$ -4t+100=0$
$t=25$
Calculate $M(t)$ for the interval endpoints: ($t=0, 40$), and critical values: ($t=25$).
$t$ $M(t)$ 0 $180$
25 $1430$
40 $980$
The maximum monthly productivity is 1430 units per month in year 25 of service.
-
A firm determines that its total profit in dollars from the production and sale of x thousand units of a product is given by: $$P(x)=\frac{1500}{{{x}^{2}}-6x+10}\quad \quad x\ge 0$$
Find the number of units x for which the total profit is a maximum.
$ P'(x)=\frac{\left( 0 \right)\left( {{x}^{2}}-6x+10 \right)-1500\left( 2x-6 \right)}{{{\left( {{x}^{2}}-6x+10 \right)}^{2}}} $
$ P'(x)=\frac{-3000x+9000}{{{\left( {{x}^{2}}-6x+10 \right)}^{2}}} $
$ \frac{-3000x+9000}{{{\left( {{x}^{2}}-6x+10 \right)}^{2}}}=\frac{0}{1} $
$ -3000x+9000=0 therefore$ x=3 $
Calculate $P(x)$ for the interval endpoint: ($x=0$), and critical value: ($x=3$). Note, we were not given an upper interval endpoint. Test one point beyond $x=3$ to identify the behavior of $P(x)$ for values of $x$ greater than the critical value of $x=3$. We will use $x=5$. Your answer will not include both a maximum and a minimum because the interval is open on one end.
$x$ $P(x)$ $0$ $150$
$3$ $1500$
$5$ $300$
Because the graph is decreasing for $x$ values greater than $3$, we have an Absolute Maximum at $(3,1500)$ but no Absolute Minimum.
The profit is maximized at $1500 when 3000 units are sold.
Norris, Ken. (1999). Optimization Problems. Retrieved from https://www.stf.sk.ca/portal.jsp?Sy3uQUnbK9L2RmSZs02CjV/Lfyjbyjsxsd+sU7CJwaIY=F
3.7 Applications of Optimization
Notes
Write a mathematical function for each of the following and then find the requested information.
Be sure to include a properly labeled diagram (if applicable) and variable statements. State the restrictions on the independent variable.
-
Find the maximum volume of an open-topped box created from a 20 cm square sheet of paper.
$V=l\cdot w\cdot h$
$V=\left( 20-2h \right)\left( 20-2h \right)h$
$V=\left( 400-40h-40h+4{{h}^{2}} \right)h$
$V=\left( 400-80h+4{{h}^{2}} \right)h$
To maximize volume:
1) Take the derivative $V'(h)$.
2) Set $V'(h)=0$ to find critical numbers.
3) Locate max(check domain issues).
$V'(h) = 12{h^2} - 160h + 400$
$V’(h)=0$ at $h=3.3$ cm, $h=10$ cm (from calculator)
(note that $h \ne 10)$
$V(3.33\bar 3 ) = 4{\left( {3.3333} \right)^3} - 80{\left( {3.3333} \right)^2} + 400\left( {3.3333} \right)$
$V(3.33\bar 3 ) = 592.59$ $ c{m^3}$
The maximum volume is approximately $592.59$ $c{m^3}$ when the height, $h$, is approximately $3.33$ cm.
-
Determine the shortest possible distance from A to B through E.
x f(x) 0 $16.77$
1 $15.9$
2 $15.2$
3 $14.8$
4 $14.4$
5 $14.2$
6 $14.1$
7 $14.4$
8 $14.5$
9 $14.9$
10 $15.7$
$D=m{\overline{AE}}+m{\overline{EB}}$
$D={{\left( {{x}^{2}}+36 \right)}^{\frac{1}{2}}}+{{\left( {{x}^{2}}-20x+116 \right)}^{\frac{1}{2}}}$
$D'(x)=\frac{1}{2}{{\left( {{x}^{2}}+36 \right)}^{-\frac{1}{2}}}(2x)+\frac{1}{2}{{\left( {{x}^{2}}-20x+116 \right)}^{-\frac{1}{2}}}\left( 2x-20 \right)$
$D'(x)=\frac{x}{\sqrt{{{x}^{2}}+36}}+\frac{x-10}{\sqrt{{{x}^{2}}-20x+116}}$
$ \text{Set }D'(x)=0$
$ \frac{x}{\sqrt{{{x}^{2}}+36}}+\frac{x-10}{\sqrt{{{x}^{2}}-20x+116}}=0$
$ -\frac{x}{\sqrt{{{x}^{2}}+36}}=\frac{x-10}{\sqrt{{{x}^{2}}-20x+116}}$
$ -x\sqrt{{{x}^{2}}-20x+116}=(x-10)\sqrt{{{x}^{2}}+36}$
$ {{\left( -x\sqrt{{{x}^{2}}-20x+116} \right)}^{2}}={{\left( (x-10)\sqrt{{{x}^{2}}+36} \right)}^{2}}$
$ {{x}^{2}}\left( {{x}^{2}}-20x+116 \right)={{\left( x-10 \right)}^{2}}\left( {{x}^{2}}+36 \right)$
$ {{x}^{4}}-20{{x}^{3}}+116{{x}^{2}}=({{x}^{2}}-20x+100)({{x}^{2}}+36)$
$ {{x}^{4}}-20{{x}^{3}}+116{{x}^{2}}={{x}^{4}}+36{{x}^{2}}-20{{x}^{3}}-720x+100{{x}^{2}}+3600$
$ {{x}^{4}}-20{{x}^{3}}+116{{x}^{2}}={{x}^{4}}-20{{x}^{3}}+136{{x}^{2}}-720x+3600$
$ 116{{x}^{2}}=136{{x}^{2}}-720x+3600$
$ 0=-116{{x}^{2}}+136{{x}^{2}}-720x+3600$
$ 20{{x}^{2}}-720x+3600=0$
$ 20({{x}^{2}}-36x+180)=0$
$ 20(x-30)(x-6)=0$
$x=30 \quad x=6$
$x=30$ is outside the domain of $x$.
Must test critical numbers and endpoints to find absolute minimum.
$ D(0)=16.77$
$ D(10)=15.66$
$ D(6)=14.14$
The absolute minimum is 14.14 cm when the distance from D to E is 6 cm.
-
When a theater owner charges \$3 for admission, there is an average attendance of 100 people. For every \$0.10 increase in admission, there is a loss of 1 customer from the average number. How much should the theater owner charge to maximize revenue and what is the maximum revenue?
x=number of .10 cent increases in admission costs
$R(x)=$(price per ticket)(number of tickets sold)
$R(x)=(3+0.10x)(100-1x)$
$R(x)=300-3x+10x-0.1{{x}^{2}}$
$R(x)=300+7x-0.1{{x}^{2}}$
$R'(x)=7-0.2x$
$7-0.2x=0$
$7=0.2x$
$35=x$
Ticket Price= $3+.1x=3+.1(35)=6.50$
Revenue= $(3+.1(35))(100-35)=422.50$
The theatre owner should charge \$6.50 per ticket to have the maximum revenue of $422.50.
-
A Norman window is a rectangle with a semi-circle on top. Find the maximum area if the perimeter is 24 feet, express the area as a function of the radius (r).
$P=2y+2r+\frac{1}{2}\left( 2\pi r \right)$
$24=2y+2r+\frac{1}{2}(2\pi r)$
$24=2y+2r+\pi r$
$\frac{24-2r-\pi r}{2}=y$
$A=l\cdot w+\frac{1}{2}\pi {{r}^{2}}$
$A=\left( \frac{24-2r-\pi r}{2} \right)2r+\frac{1}{2}\pi {{r}^{2}}$
$A=\left( 24-2r-\pi r \right)r+\frac{1}{2}\pi {{r}^{2}}$
$A=24r-2{{r}^{2}}-\pi {{r}^{2}}+\frac{1}{2}\pi {{r}^{2}}$
$A=24r-2{{r}^{2}}-\frac{1}{2}\pi {{r}^{2}}$
$ A'(r)=24-4r-\pi r$
$ 24-4r-\pi r=0$
$ 24=4r+\pi r$
$ 24=r(4+\pi)$
$ r=\frac{24}{4+\pi }\approx 3.36ft$
The area is maximized when the radius is $3.36$ feet and the height of the window is $3.36$ feet.
The maximum area is $40.33$ $ft^2.$
-
A lifeguard has 200 m of rope and some buoys with which she intends to enclose a rectangular area at a lake for swimming. The beach will form one side of the rectangle, with the rope forming the other three sides. Find the dimensions that will produce the maximum area.
$A=lw$
$A(x)=x(200-2x)$
$A(x)=200x-2x^2$
$A(x)=-2x^2+200x$
$ A'(x)=-4x+200$
$ -4x+200=0$
$ -4x=-200$
$ x=50$
$ A(50)=-2{{\left( 50 \right)}^{2}}+200(50)=5000$ ${{m}^{2}}$
The maximum area possible is $5000$ $m^2.$
This can be achieved by building the swim area with the dimensions $50$ meters x $100$ meters.