MATH 1830

Unit 2 Applications of Derivatives

2.4 Graph Analysis: Polynomials


2.4 Video

Matching functions with their derivatives.

Match the function with its first and second derivatives.
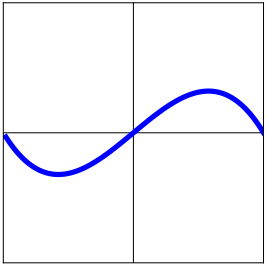
A polynomial graph, with no numbers on the x- or y-axes, starts with an x-intercept on the left side, is below the x-axis, and decreases until about halfway to the origin where it changes to increasing.  It is concave up from the left to the origin.  At the origin, the graph continues to increase and is above the x-axis.  It increases until about halfway to the right side of the graph where it decreases until it intersects the x-axis.  It is concave down from the origin to the end of the graph on the right.
  1. Pick the graph of the First Derivative of the function above.
  2. Four polynomial graphs.  No units on the axes.  #1 from the left: Positive (above the x-axis), increasing for a tiny bit and then decreasing until the origin. Concave down from the left to the origin.  After the origin it is negative (below the x-axis), concave up, decreasing until the very right side of the graph when it changes to increasing.
                #2: From the left- Positive and decreasing, x-intercept, negative and decreasing, changes to increasing until x-intercept at origin.  Concave up in this interval.  To the right of the origin the function is positive and increasing for a bit and then positive and decreasing until it hits another x-intercept where it becomes negative and decreasing.  It is concave down from the origin to the end of the graph.
                #3: Negative and decreasing for a bit then increases until it intersects the origin. It is concave up on that interval.  After it crosses the origin, it is positive and continues to increase for a bit and then stays positive but decreases.
                #4: A parabola that is negative and increasing until it crosses the x-axis to the left of the origin, where it becomes positive and increasing.  It reaches its max at a positive y when x=0 and then decreases throughout the right half of the graph.  It crosses the x-axis again about halfway between the origin and the right side of the graph.

    Graph 4

  3. Pick the graph of the Second Derivative of the function above.
  4. Four polynomial graphs.  No units on the axes.  
                    Graph A from the left: Negative (below the x-axis) and increasing, x-intercept, positive (above x-axis) and increasing, max at x=0, positive and decreasing, x-intercept, negative and decreasing.  
                    Graph B from the left: Linear graph with negative slope. Positive and decreasing, x-intercept at the origin, negative and decreasing.
                    Graph C from the left: Positive and decreasing, x-intercept, negative and decreasing, minimum at x=0, negative and increasing, x-intercept, positive and increasing
                    Graph D from the left-: A parabola that is negative and increasing, x-intercept, positive and increasing, max at x=0, positive and decreasing, x-intercept, negative and decreasing.

    Graph B

    Source Oliver Knill, Knill@math.harvard.edu, Math 1A, Harvard College, Spring 2020


    2.4 Lecture

  5. Match the function with its first and second derivatives.
  6. Four polynomial graphs labeled a-d.
                Graph a from the left: x-intercept, negative and decreasing, minimum, negative and increasing, x-intercept at origin, positive and increasing, max, positive and decreasing. Concave up from left to origin.  Concave down from origin to the right.
                Graph b from the left: positive and decreasing, minimum at origin, positive and increasing.  Concave up on the entire graph.
                Graph c from the left: positive and increasing, maximum point, positive and decreasing, minimum and x-intercept at the origin, positive and increasing, maximum point, positive and decreasing. Concave down from the left to halfway to the origin.  Concave up until midway between the origin the the right side of the graph.  Concave down.
                Graph d from the left: Parabola.  negative and inceasing, x-intercept, positive and increasing, maximum at x=0, positive and decreasing, x-intercept, negative and decreasing.

    First Derivatives of the function above.

    Four polynomial graphs.  No units on the axes.  #1 from the left: Positive (above the x-axis), increasing for a tiny bit and then decreasing until the origin. Concave down from the left to the origin.  After the origin it is negative (below the x-axis), concave up, decreasing until the very right side of the graph when it changes to increasing.
                #2: From the left- Positive and decreasing, x-intercept, negative and decreasing, changes to increasing until x-intercept at origin.  Concave up in this interval.  To the right of the origin the function is positive and increasing for a bit and then positive and decreasing until it hits another x-intercept where it becomes negative and decreasing.  It is concave down from the origin to the end of the graph.
                #3: Negative and decreasing for a bit then increases until it intersects the origin. It is concave up on that interval.  After it crosses the origin, it is positive and continues to increase for a bit and then stays positive but decreases.
                #4: A parabola that is negative and increasing until it crosses the x-axis to the left of the origin, where it becomes positive and increasing.  It reaches its max at a positive y when x=0 and then decreases throughout the right half of the graph.  It crosses the x-axis again about halfway between the origin and the right side of the graph.

    Second Derivatives of the function above.

    Four polynomial graphs.  No units on the axes.  
                    Graph A from the left: Negative (below the x-axis) and increasing, x-intercept, positive (above x-axis) and increasing, max at x=0, positive and decreasing, x-intercept, negative and decreasing.  
                    Graph B from the left: Linear graph with negative slope. Positive and decreasing, x-intercept at the origin, negative and decreasing.
                    Graph C from the left: Positive and decreasing, x-intercept, negative and decreasing, minimum at x=0, negative and increasing, x-intercept, positive and increasing
                    Graph D from the left-: A parabola that is negative and increasing, x-intercept, positive and increasing, max at x=0, positive and decreasing, x-intercept, negative and decreasing.

    a,4,B

    b,3,A

    c,2,D

    d,1,C

    Source Oliver Knill, Knill@math.harvard.edu, Math 1A, Harvard College, Spring 2020


    2.4 Group Work

    Matching Cards Activity

    2.4 Additional Practice

    The Big Derivative Puzzle


    Visualizing Derivatives


    Visualizing Derivatives


    Desmos Curve Sketching


    Try to Graph the Derivative