MATH 1830 Notes
Unit 2 Applications of Derivatives
2.2 First Derivative Test
First Derivative Test
Analyze $f'(x)$ to Identify Intervals of Increase/Decrease and Extrema on the Graph of $f(x).$
- Find $f'(x)$
- Identify all critical numbers and partitions for the function.
- Values of $x$ where$f'(x)=0$ are critical numbers.
- Values of $x$ where $f'(x)$ is undefined are partitions.
- Values of $x$ where $f(x)$ is undefined are partitions.
- Graph the critical numbers and partitions on a number line, separating the number line into intervals.
- Determine the intervals on which $f(x)$ is increasing /decreasing
- Test one point contained in the interval (do not use the end points of the interval).
- $f'(x)<0$ then the function $f(x)$ is DECREASING on the interval
- $f'(x)>0$ then the function $f(x)$ is INCREASING on the interval
- Identify local maxima and minima of $f(x)$ using the First Derivative Test.
- On the interval $(a,c)$, a local maximum occurs at $f(b)$ when $f(x)$ is increasing for all $x$ in the interval $(a,b]$ and $f(x)$ is decreasing for all $x$ in the interval $[b,c)$.
- On the interval $(a,c)$, a local minimum occurs at $f(b)$ when $f(x)$ is decreasing for all $x$ in the interval $(a,b]$ and $f(x)$ is increasing for all $x$ in the interval $[b,c)$.
2.2A Video
Use the First Derivative Test to analyze the function. Identify x- & y-intercepts, and any holes or asymptotes (if they exist).
-
$f(x)={{x}^{3}}+6{{x}^{2}}+9x$
x-intercept(s)
${{x}^{3}}+6{{x}^{2}}+9x=0$
$x\left( {{x}^{2}}+6x+9 \right)=0 $
$x{\left( x+3 \right)}{\left( x+3 \right)}=0 $
$x=0\,\,,\,\,x=-3$
$\left( 0,0 \right)\,\text{and}\,\left( -3,0 \right)$
y-intercept
$f\left( 0 \right)={{\left( 0 \right)}^{3}}+6{{\left( 0 \right)}^{2}}+9\left( 0 \right)=0$
$\left( 0,0 \right)$
Holes & Asymptotes
There are no holes or asymptotes. The function is a polynomial.
-
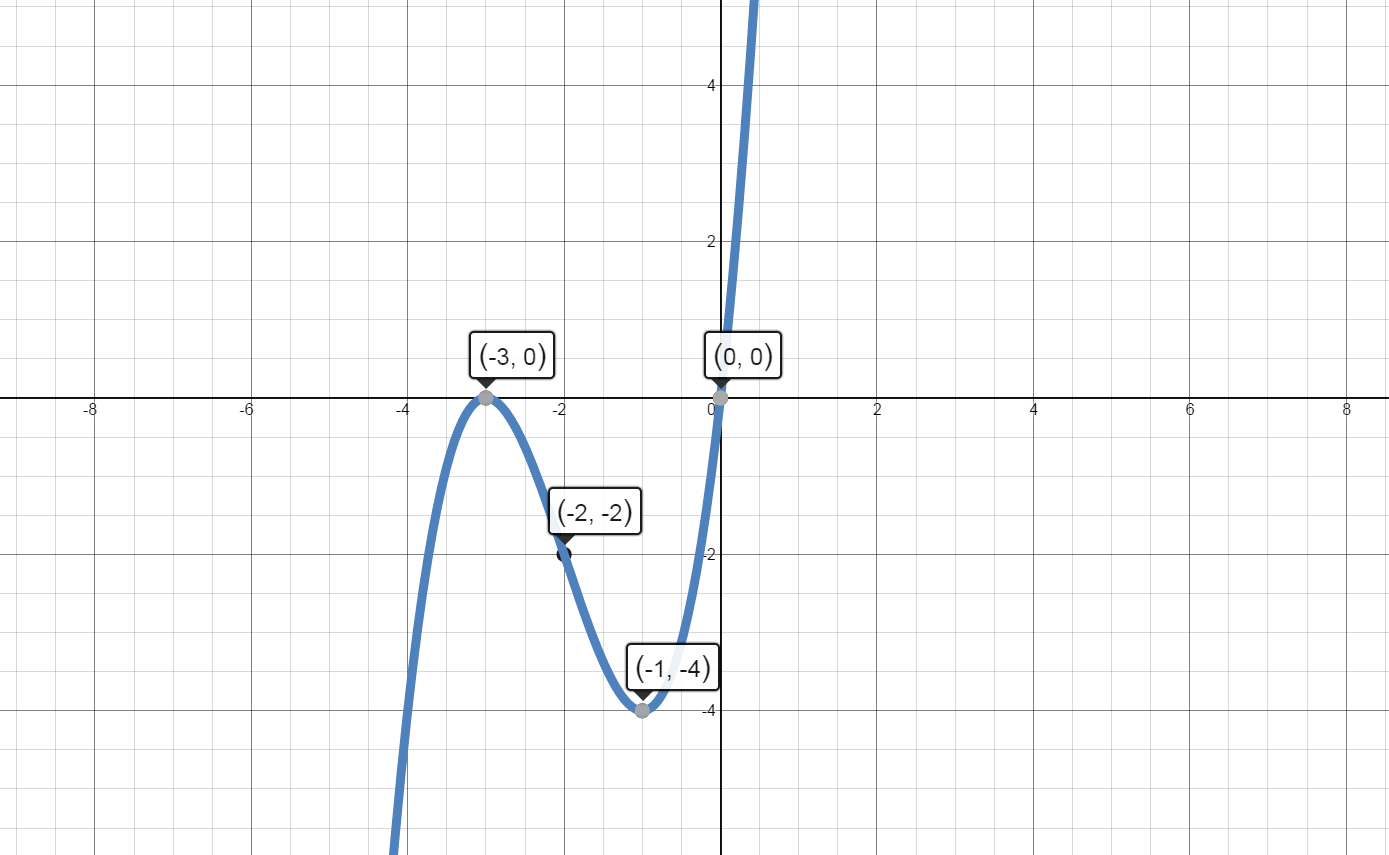
$f(x)={{x}^{3}}+6{{x}^{2}}+9x$
-
Increasing and Decreasing
${f}'(x)=3{{x}^{2}}+12x+9$
Values of x where ${f}'(x)=0: \quad 3{{x}^{2}}+12x+9=0$
$3\left( x+3 \right)\left( x+1 \right)=0$
$3 \neq 0$
$x=-3$
$x=-1$
Values of x where ${f}'\left( x \right)$ is undefined:
There are no values of x where ${f}'\left( x \right)$ is undefined.
Values of x where $f\left( x \right)$ is undefined:
There are no values of x where $f\left( x \right)$ is undefined.
Separate into intervals using: $x=-3$ and $x=-1$.
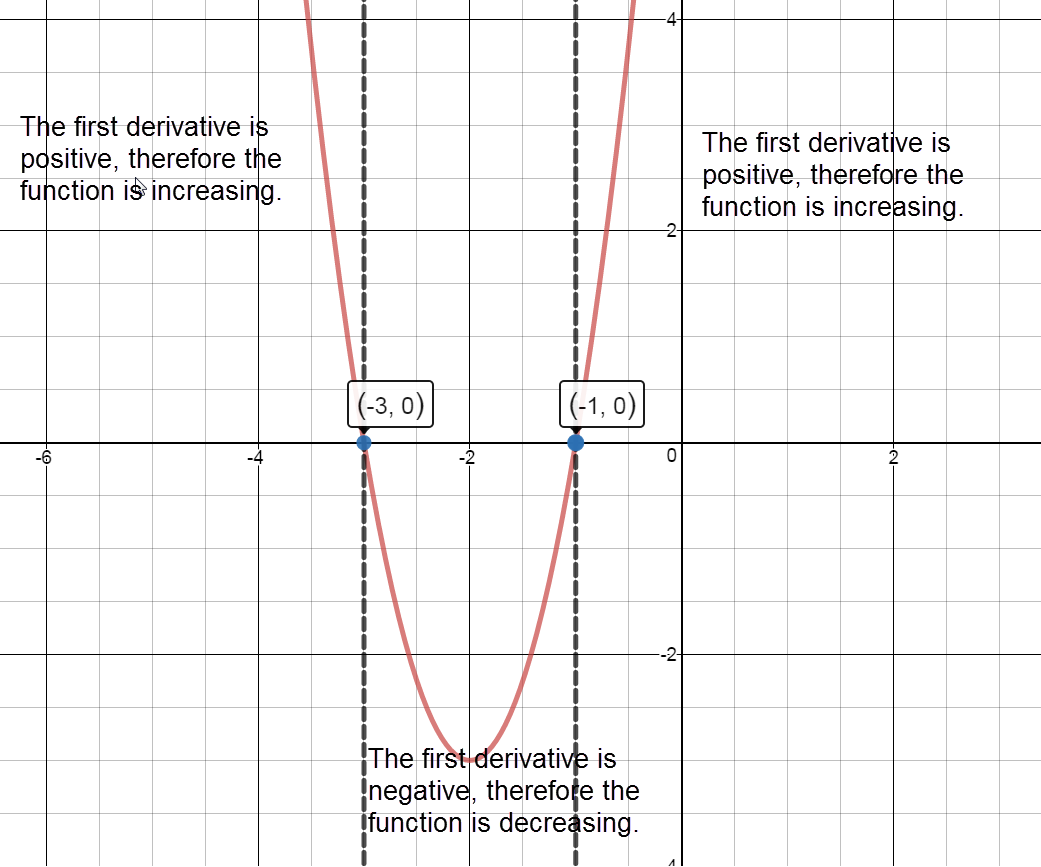
Sign graph of ${f}'(x)$ reading left to right: positive, ${f}'\left( -3 \right)=0$, negative, ${f}'\left( -1 \right)=0$, positive Increasing:
The graph of $f(x)$ is increasing on the intervals $\left( -\infty ,-3 \right)\cup \left( -1,\infty \right)$.
Decreasing:
The graph of $f(x)$ is decreasing on the interval $\left( -3,-1 \right)$.
-
Local Maxima:
$f\left( -3 \right)={{\left( -3 \right)}^{3}}+6{{\left( -3 \right)}^{2}}+9\left( -3 \right)=0$
There is a local maximum at the point $\left( -3,0 \right)$.
Local Minima:
$f\left( -1 \right)={{\left( -1 \right)}^{3}}+6{{\left( -1 \right)}^{2}}+9\left( -1 \right)=-4$
There is a local minimum at the point $\left( -1,-4 \right)$.
-
-
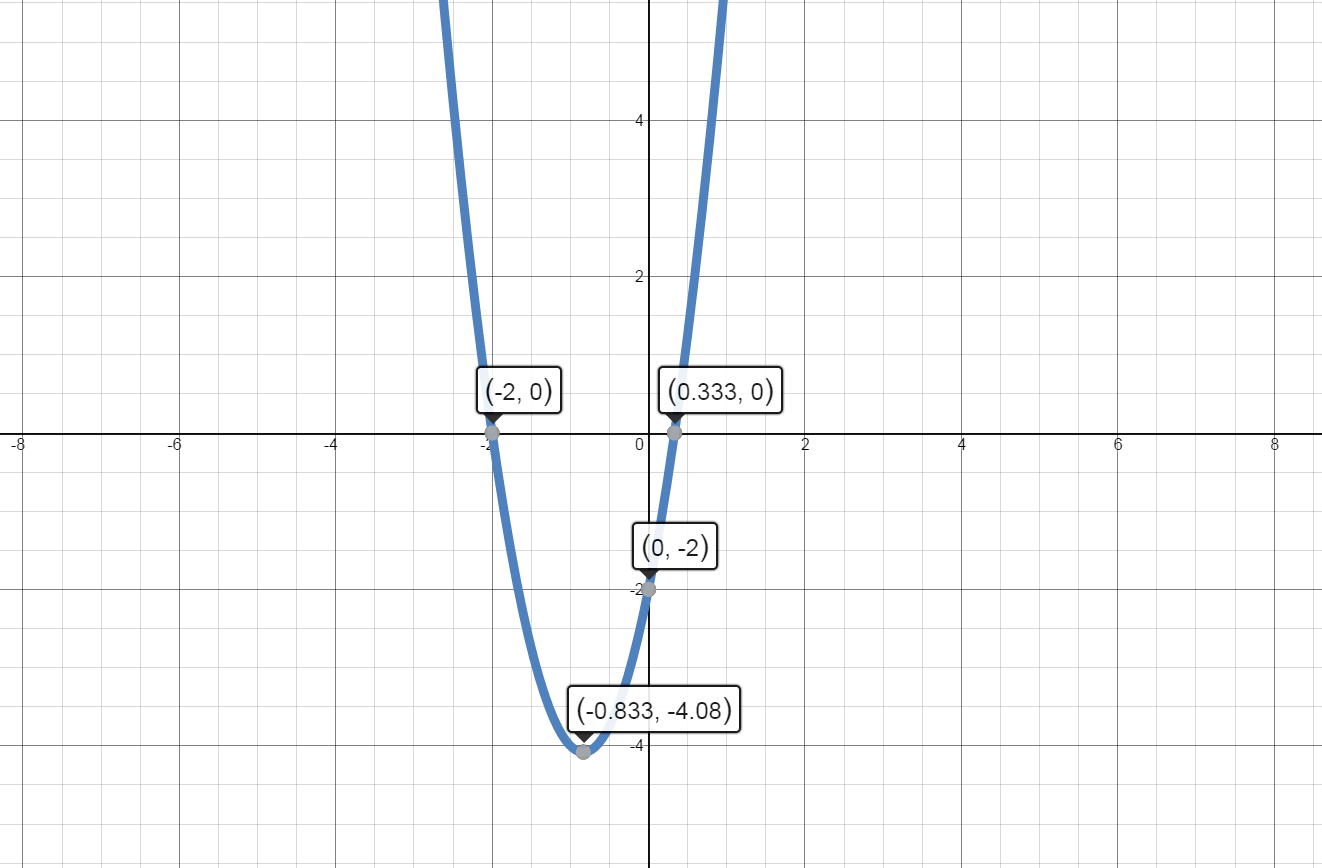
$f(x)=3{{x}^{2}}+5x-2$
-
x intercept(s):
$ 0=3{{x}^{2}}+5x-2 $
$ 0=\left( 3x-1 \right)\left( x+2 \right) $
$x=\frac{1}{3}\,\,,\,\,x=-2$
$\left( \frac{1}{3},0 \right)\,\text{and}\,\left( -2,0 \right)$
-
y intercept:
$f\left( 0 \right)=0+0-2=-2$
$\left( 0,-2 \right)$
-
Holes & Asymptotes:
There are no holes or asymptotes. The function is a polynomial.
-
Increasing and Decreasing
${f}'(x)=6x+5$
Values of x where ${f}'(x)=0:$
$6x+5=0$
$6x=-5$
$x=-\frac{5}{6}$
Values of x where ${f}''\left( x \right)\;$is undefined:
There are no values of x where ${f}''\left( x \right)\;$is undefined.
Values of x where $f\left( x \right)\;$is undefined:
There are no values of x where $f\left( x \right)\;$is undefined.
Separate into intervals using: $x=-\frac{5}{6}$.
Sign graph of ${f}'(x)$ reading left to right: negative, ${f}'\left( -\frac{5}{6} \right)=0$ , positive Increasing:
The graph of $f(x)$ is increasing on the interval $\left( -\frac{5}{6},\infty \right)$.
Decreasing:
The graph of $f(x)$ is decreasing on the interval $\left( -\infty ,-\frac{5}{6} \right)$.
-
local max:
There are no local maxima.
local min:
$f\left( -\frac{5}{6} \right)=3{{\left( -\frac{5}{6} \right)}^{2}}+5\left( -\frac{5}{6} \right)-2= -\frac{49}{12}$
There is a local minimum at the point $\left( -\frac{5}{6},-\frac{49}{12} \right)$.
-
-
Use the First Derivative Test to analyze $f'(x)$ and identify intervals of increase/decrease and extrema on the graph of $f(x)$.
$f(x)=2x^3+3x^2-12x+5$
-
Increasing and Decreasing
${f}'(x)=6x^2+6x-12$
Values of x where ${f}'(x)=0:$
$6x^2+6x-12=0$
$6(x^2+x-2)=0$
$6(x+2)(x-1)=0$
$x=-2,1$
Values of x where ${f}'\left( x \right)\;$is undefined:
There are no values of x where ${f}'\left( x \right)\;$is undefined.
Values of x where $f\left( x \right)\;$is undefined:
There are no values of x where $f\left( x \right)\;$is undefined.
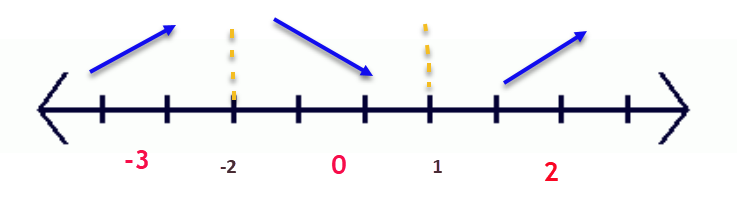
Separate into intervals using: $x=-2 & 1.
Increasing:
The graph of $f(x)$ is increasing on the interval $(-\infty,-2) ∪ (1, \infty) $.
Decreasing:
The graph of $f(x)$ is decreasing on the interval $(-2,1)$.
-
local max:
$f(-2)=2(-2)^3+3(-2)^2-12(-2)+5$
There is local maxima at (-2, 25).
local min:
$f(1)=2(1)^3+3(1)^2-12(1)+5$
There is a local minimum at the point $(1, -2)$.
-
-
The annual first quarter change in revenue for Apple, Inc. is given by the regression model: $$f(x)=-0.005x^4+0.113x^3-0.889x^2+7.946x-5.346$$ where x is Years Since 1998 until 2016.
Use the First Derivative Test to analyze $f'(x)$ and identify intervals of increase/decrease and extrema on the graph of $f(x)$.
$f'(x)=-0.02x^3+0.339x^2-1.778x+7.946$
-
Identify the values of x where $f'(x)=0$:
$f'(x)=0$ at $x=12.358$
Values of x where $f'(x)$ is undefined:
There are no values of x where $f'(x)$ is undefined.
Values of x where $f(x)$ is undefined:
There are no values of x where $f(x)$ is undefined.
Separate the graph of $f'(x)$ into intervals using: $x=12.358$.
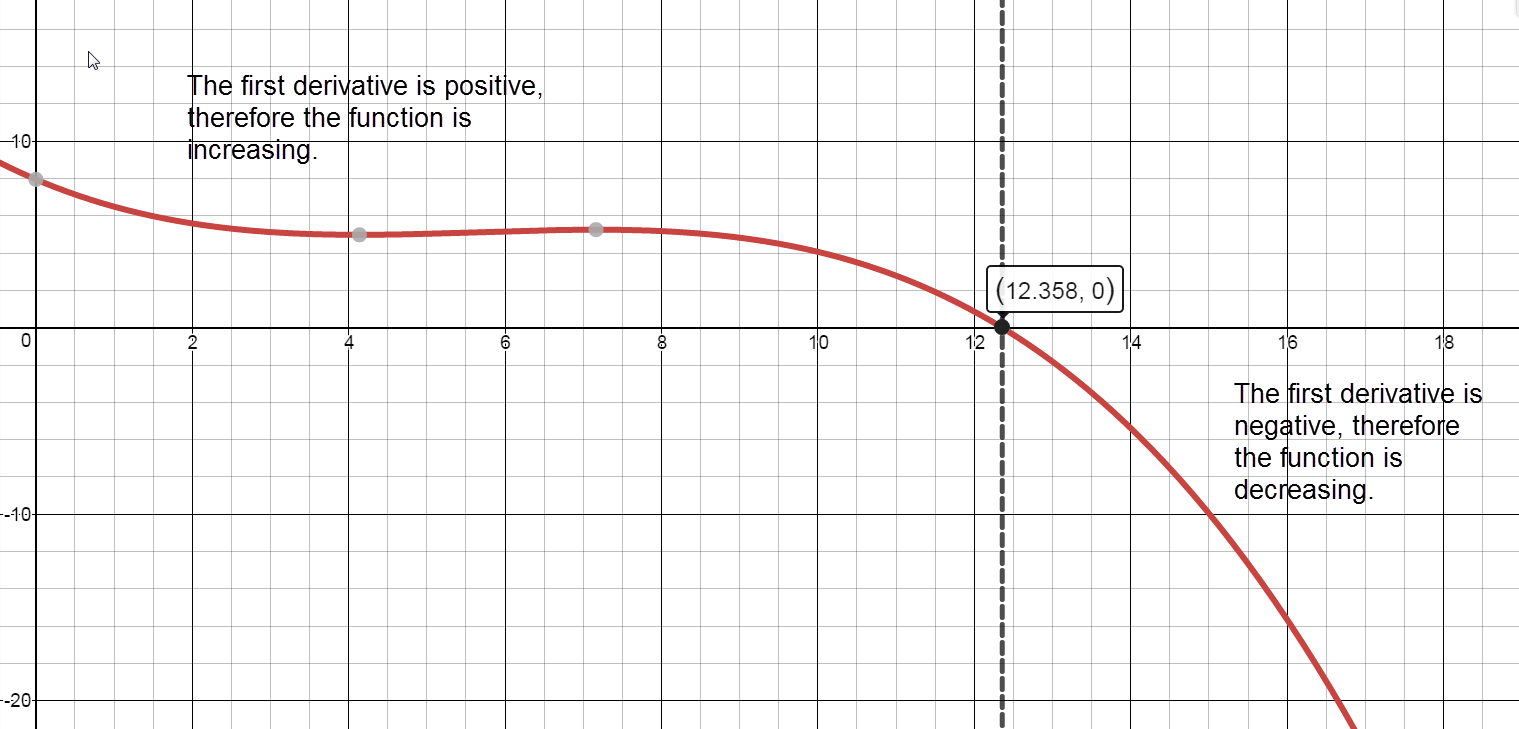
Sign graph of ${f}'(x)$ reading left to right: positive, ${f}'\left( 12.358 \right)=0$, negative Intervals of Increase and Intervals of Decrease
Increasing:
$[0,12.358)$
The percent change in revenue was increasing from 1998 into 2010.
Decreasing:$(12.358,18]$
The percent change in revenue was decreasing in 2010 through 2016.
- Extrema
Local maximum:
$(12.358, 53.732)$
From the model, the maximum percent change in revenue occurs in 2010 (at x=12.358 years after 1998).
Local minimum:There are no local minima.
-
-
Using data from the Federal Reserve, the S&P 500 annual percent return on investments for the years 2008-2014 can be modeled by the following equation: $$A(t) = - 1.64{t^4} + 20.85{t^3} - 86.05{t^2} + 127.87t - 36.24$$ where t is in years since 2008 and A(t) is in percent.
Source: http://pages.stern.nyu.edu/~adamodar/New_Home_Page/datafile/histretSP.html
Use the First Derivative Test to analyze $A'(t)$ and identify intervals of increase/decrease and extrema on the graph of $A(t)$.
${A}'\left( t \right)=-6.56{{t}^{3}}+62.55{{t}^{2}}-172.10t+127.87$
-
Graph the critical numbers on a number line and determine the sign for each interval.
Values of t where ${A}'\left( t \right)=0$:
$0=-6.56{{t}^{3}}+62.55{{t}^{2}}-172.10t+127.87$
${A}'\left( t \right)=0$ when $t\approx 1.20$, $t\approx 3.10$, $t\approx 5.23$
Values of t where ${A}'\left( t \right)$ is undefined:
There are no values of t where ${A}'\left( t \right)$ is undefined.
Values of t where ${A}\left( t \right)$ is undefined:
There are no values of t where ${A}\left( t \right)$ is undefined.
Separate into intervals using: $t=1.20$, $t=3.10$ and $t=5.23$.
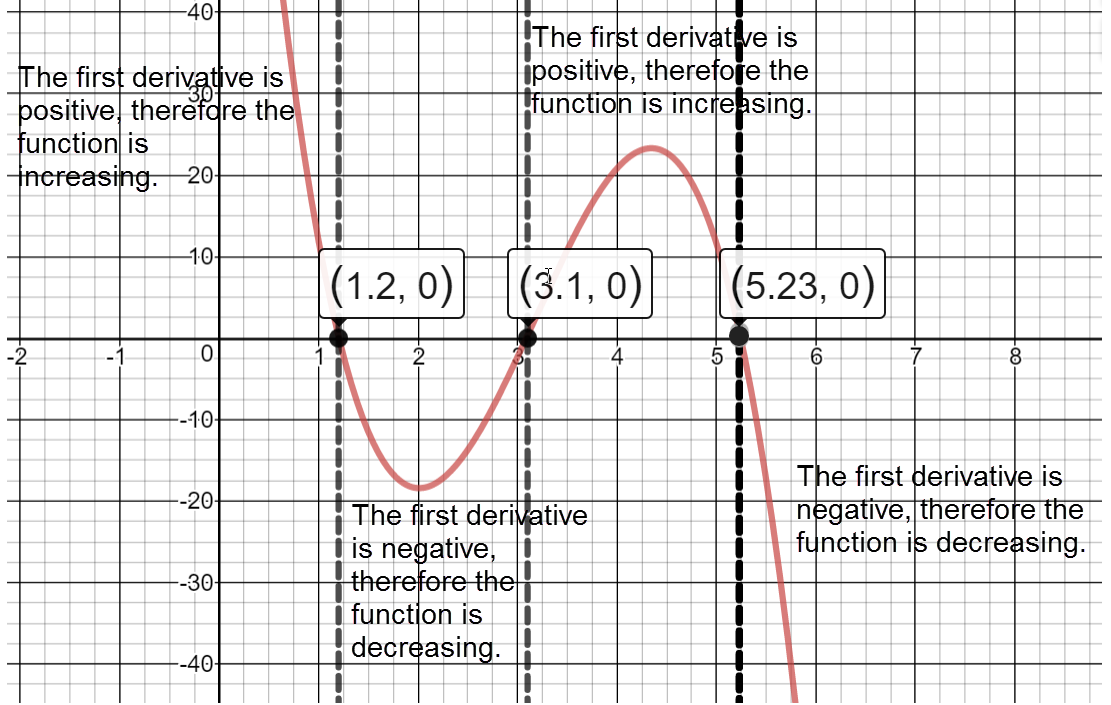
Sign graph of ${A}'(x)$ from left: positive, ${A}'\left( 1.20 \right)\approx 0$, negative, ${A}'\left( 3.10 \right)\approx 0$, positive, ${A}'\left( 5.23 \right)\approx 0$, negative Determine the intervals on which $A(t)$ is increasing/decreasing.
The function is increasing on the intervals: $\left( 0,1.20 \right)\cup \left( 3.10,5.23 \right).$
APR increased from 2008 into 2009 and from 2011 into 2013.
The function is decreasing on the intervals: $\left( 1.20,3.10 \right)\cup \left( 5.23,6 \right).$
APR decreased from 2009 into 2011 and in 2013.
-
Identify local maxima and minima for $A(t)$.
There are two Local Maxima at the points: $\left( 1.20,25.92 \right)$ and $\left( 5.23,34.50 \right).$
There is a Local Minimum at the point: $\left( 3.10,2.90 \right).$
-
-
Using data from Statista, the total annual amount spent on the purchase of golf equipment in the United States for the years 2008-2014 can be modeled by the following equation:
$$A(t)=-31.94{{t}^{3}}+301.16{{t}^{2}}-665.61t+3454.63$$ where t is in years since 2008 and A(t) is in millions of dollars.
Use the First Derivative Test to analyze the function. Identify intervals of increase/decrease and extrema on the graph of the function.
${A}'\left( t \right)=-95.82{{t}^{2}}+602.32t-665.61$
-
Graph the critical numbers on a number line and determine the sign for each interval.
Values of t where ${A}'\left( t \right)=0:$
$t=1.43$ and $t=4.86$
Values of t where ${A}'\left( t \right)$ is undefined:
There are no values of t where ${A}'\left( t \right)$is undefined.
Values of t where ${A}\left( t \right)$ is undefined:
There are no values of t where $A\left( t \right)$ is undefined.
Separate into intervals using: $t=1.43$ and $t=4.86$.
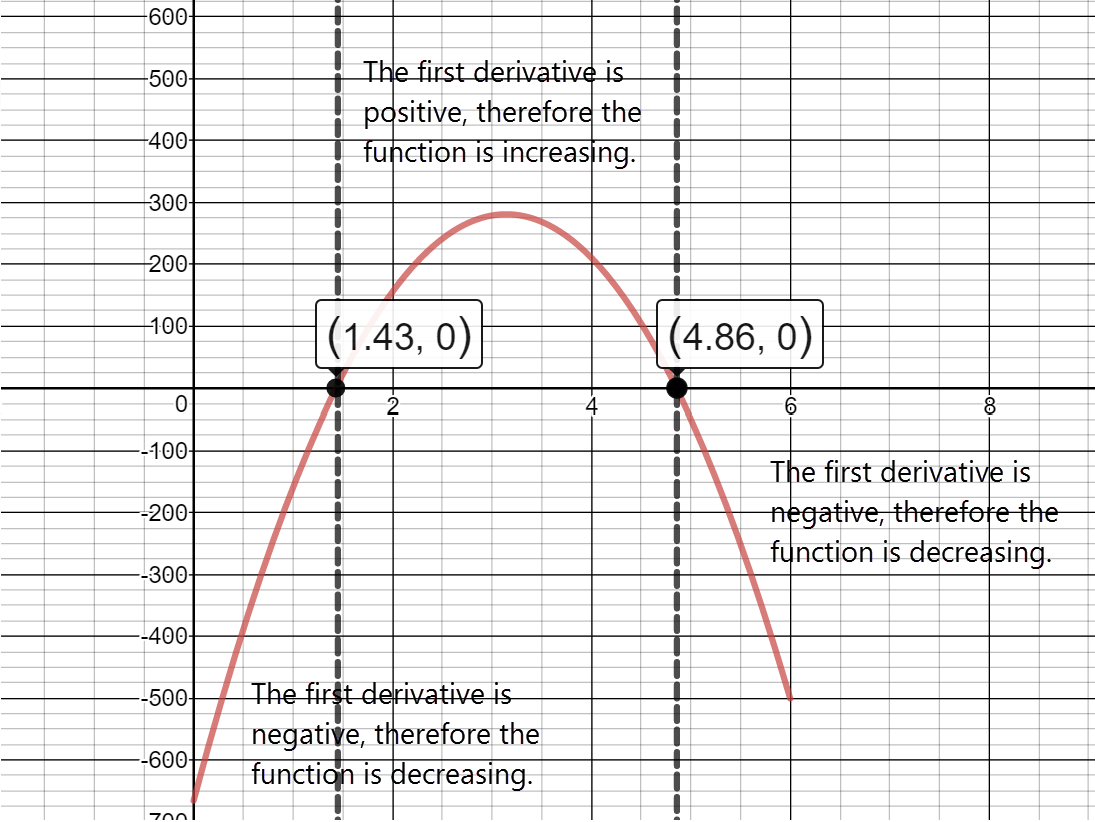
Sign chart for ${A}'\left( t \right)$ reading left to right: negative, ${A}'\left( 1.43 \right)\approx 0$, positive, ${A}'\left( 4.86 \right)\approx 0$, negative Determine the intervals on which $A(t)$ is increasing/decreasing.
The function is increasing on the interval: $\left( 1.43,4.86 \right).$
From 2009 to 2012, purchase amounts of golf equipment in the US increased each year.
The function is decreasing on the intervals: $\left( 0,1.43 \right)\cup \left( 4.86,6 \right).$
In 2008 into 2009 and in 2013 and 2014, purchase amounts of golf equipment decreased.
-
Identify local maxima and minima for $A(t)$.
There is a Local Maximum at the point: $\left( 4.86,3666.61 \right).$
There is a Local Minimum at the point: $\left( 1.43,3025.25 \right).$
-
2.2B Video
Use the First Derivative Test to analyze the function. Identify intervals of increase, decrease, and extrema on the graph of the function.
2.2 A&B Lecture
Use the First Derivative Test to analyze the function. Identify x- & y-intercepts, any holes or asymptotes (if they exist), intervals of increase/decrease, and extrema on the graph of the function.
2.2 Group Work
2.2 Additional Practice
Use the First Derivative Test to analyze the function. Identify intervals of increase/decrease and extrema on the graph of the function.